
Navigate page:
People take the time to adjust settings on their smartphones, and the EHR should be no different. User settings can reduce the amount of time spent on clicks, typing, scrolling, and more. Emergency physicians should continue to update their user settings over time.
Improve Documentation Efficiency
Epic has a variety of tools that can make writing patient notes faster and easier:
SmartPhrases
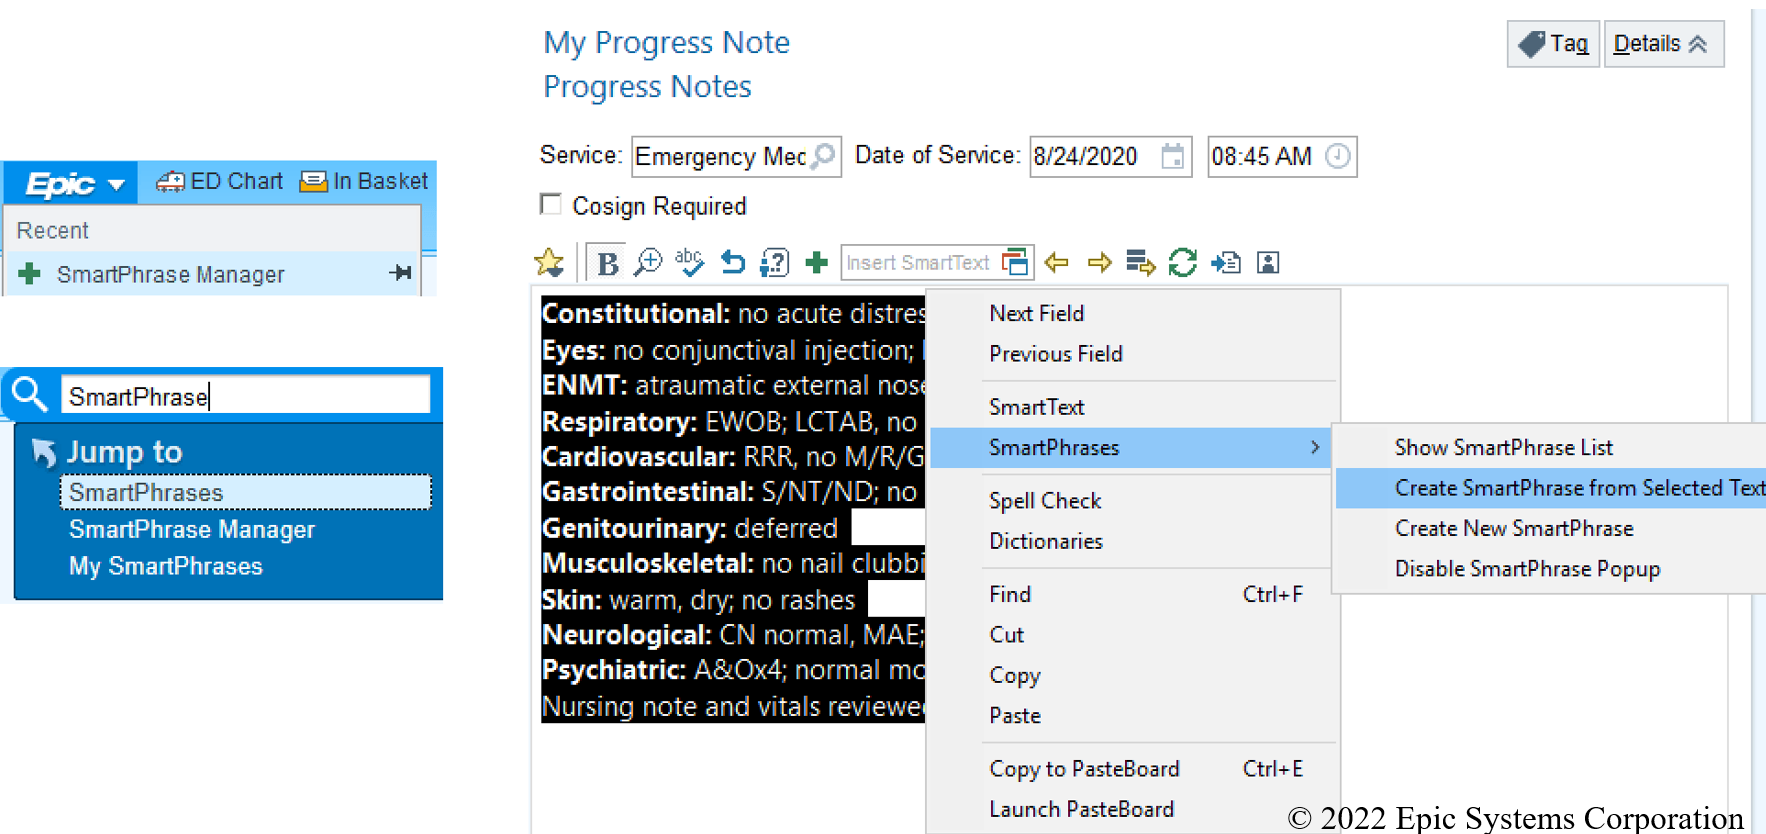
Also known as “dot phrases,” SmartPhrases allow commonly used chunks of text to easily be inserted into patient notes or discharge instructions by typing a period (the dot) followed by a short user generated phrase. These phrases may be as short as a single sentence (eg: .hpibackpain might include a sentence that states the patient does not have any “red flag” symptoms) or as long as an entire note template. SmartPhrases can be created by individual users, shared with or discovered by other users, or made more widely available by making them department-level or hospital-wide SmartPhrases (requires the help of your hospital’s IT department). SmartPhrases can be created using the “SmartPhrase Manager” or by highlighting existing text within a note and right-clicking to convert to a SmartPhrase.
ACEP has created some SmartPhrases that you may want to add to your SmartPhrase manager.
Figure 1. Creating New SmartPhrases
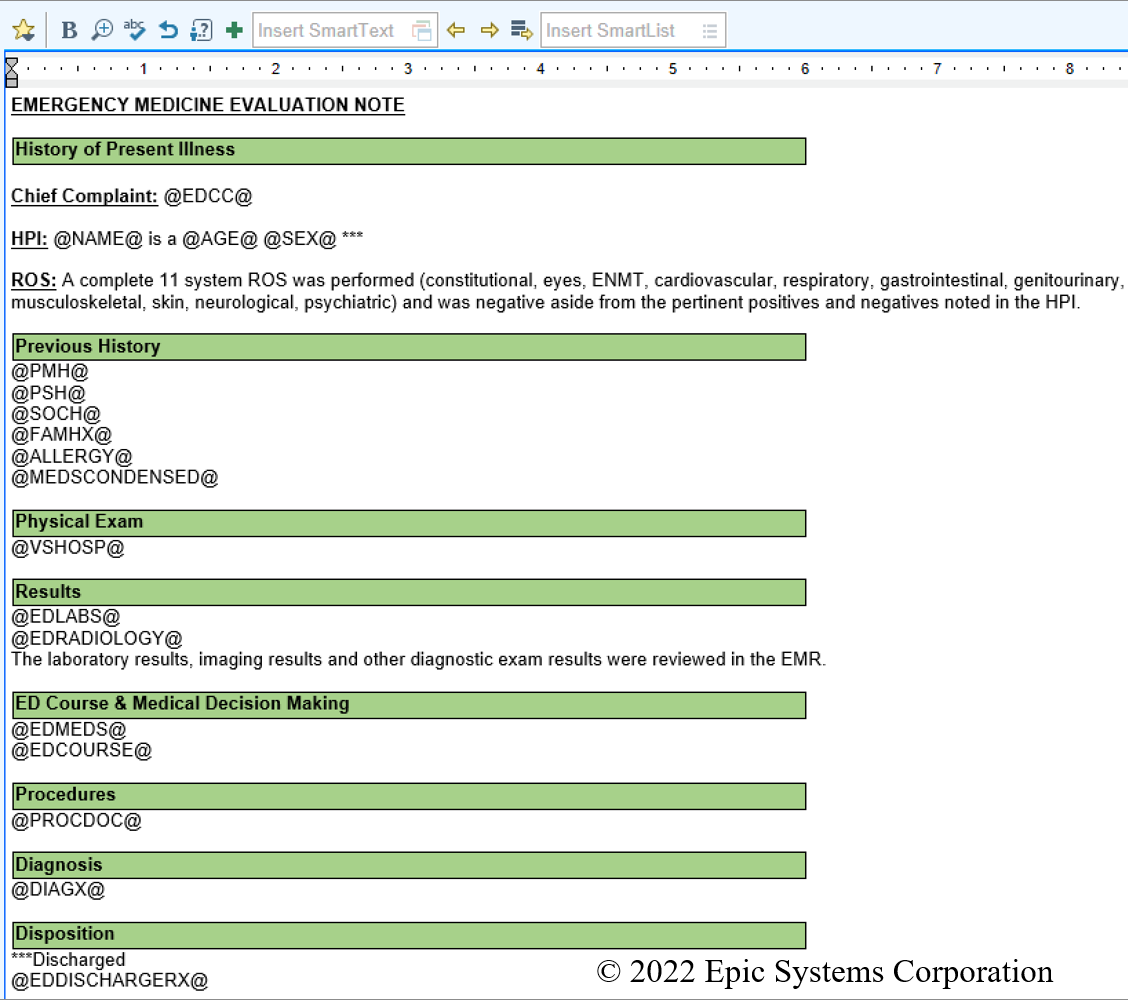
SmartPhrases can also be configured to pull in SmartText and SmartLists, and can include additional syntax to help with note writing such as three asterisks (***) that prompt you to fill in a blank or to double-check that the default text does not need to be modified, or brackets around sections of text that allow them to be navigated using key commands included with dictation software. You can quickly jump between *** wildcards using F2 or using hotkeys included with many voice dictation solutions.
SmartText allows data already populated elsewhere in Epic to be pulled into your note automatically. This can include the patient’s chief complaint, their name, age, sex, prior history, vital signs, results, diagnoses, and more (denoted using the @ symbols in Figure 2).
Figure 2. SmartText Included Within a SmartPhrase
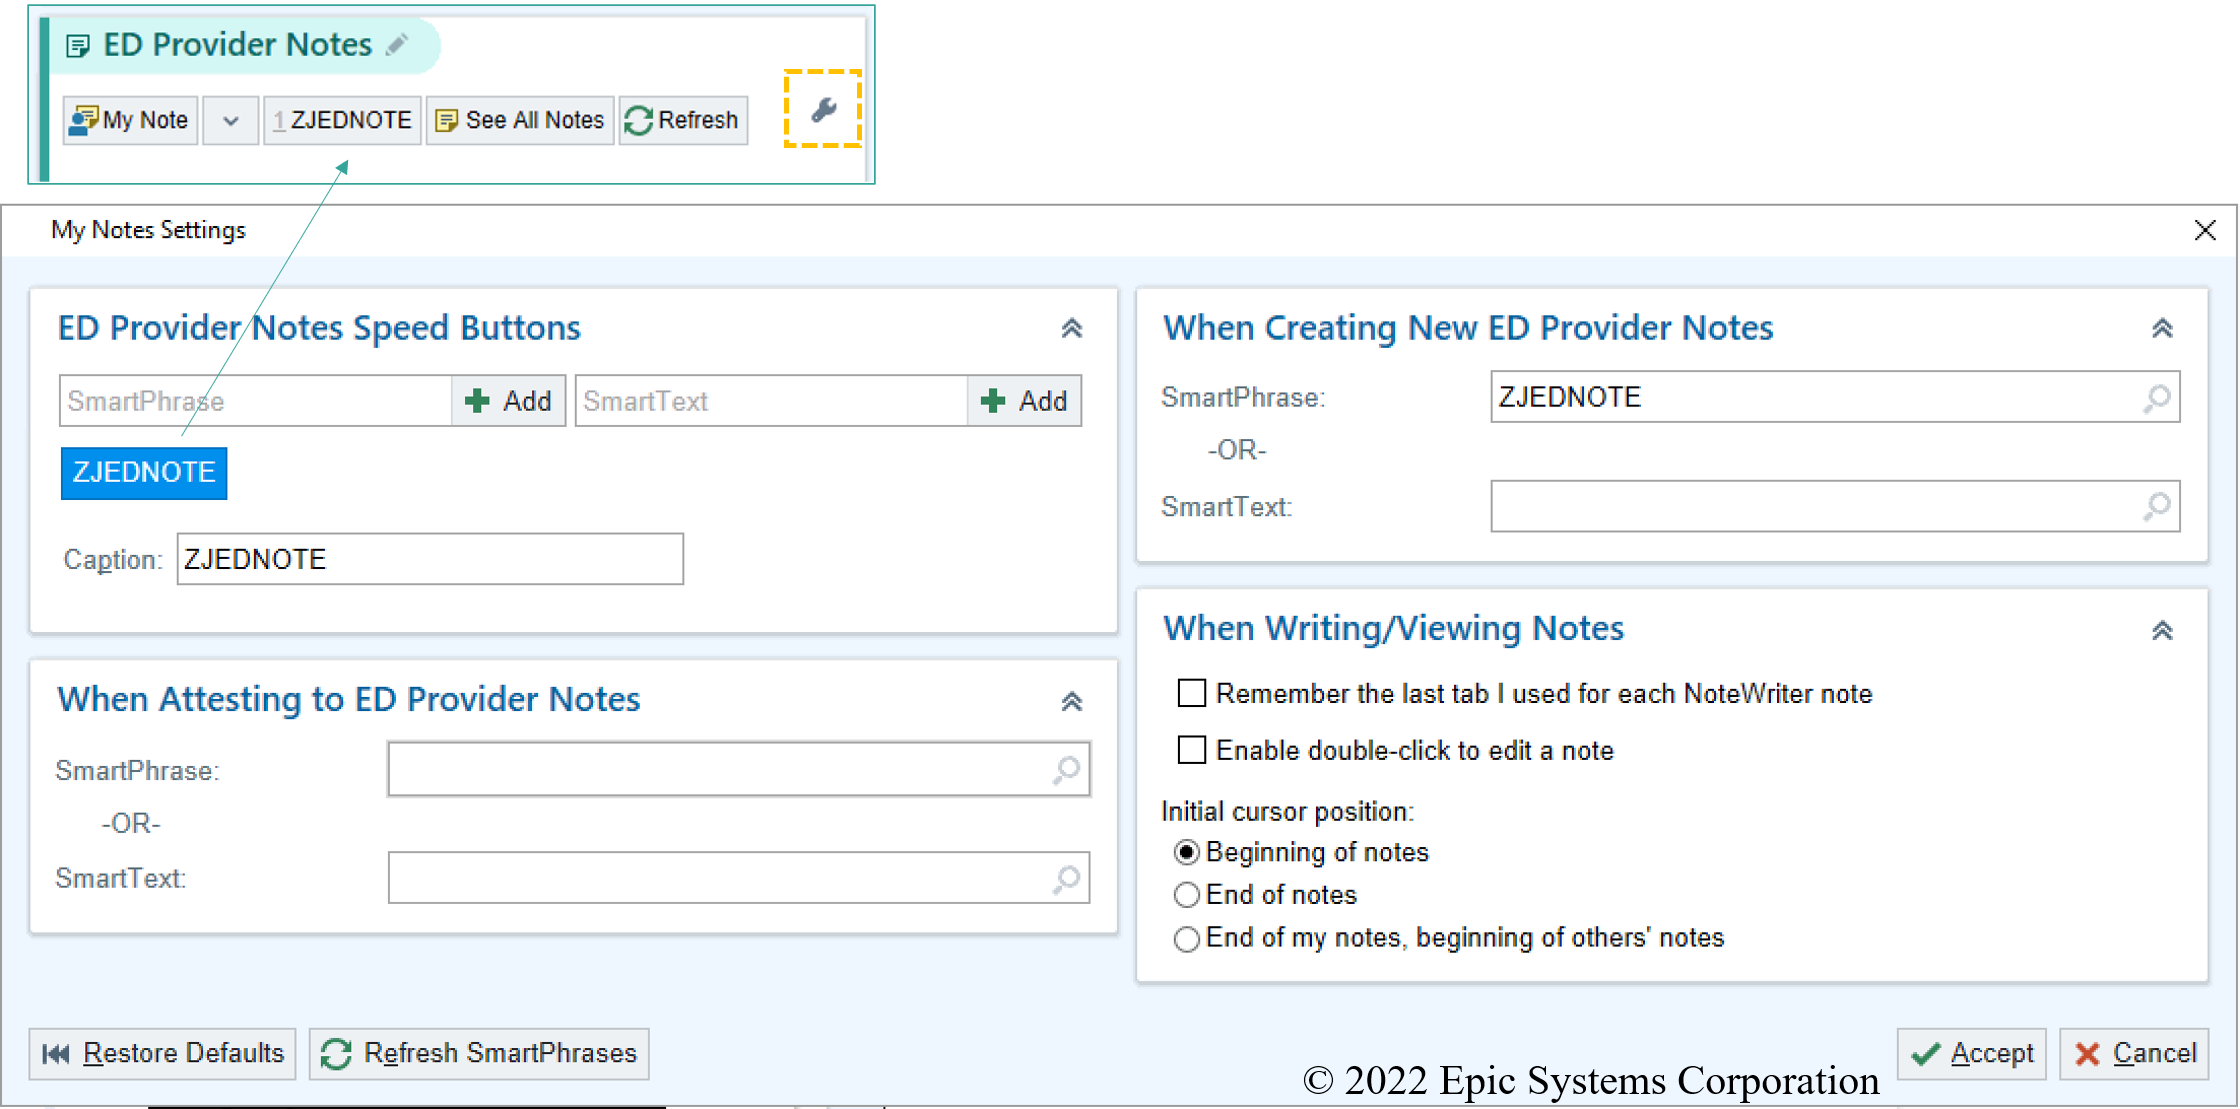
SmartPhrases that are used to create specific types of notes (eg: generic evaluation note, chief complaint-specific evaluation note, assumption of care note) can also be used to create Speed Buttons that allow you to create a new note that pre-populates with a specific SmartPhrase.
Figure 3. Creating QuickButtons to Generate New Note Using SmartPhrase
SmartLists
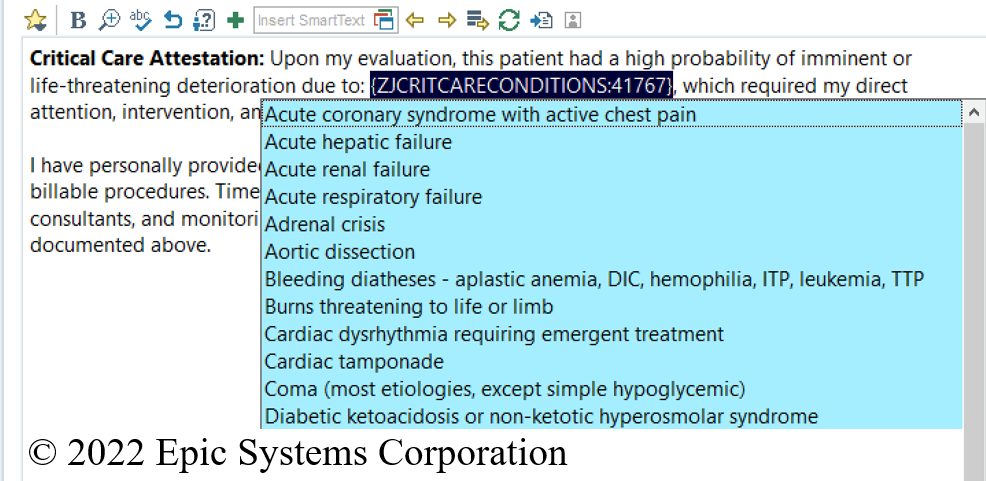
For certain scenarios, users might find that selecting something from a list to be the best way to enter information into a chart. For example, within a critical care attestation statement, it may be helpful to be able to reference a list of conditions that frequently qualify for critical care (list of conditions borrowed from aliem.com).
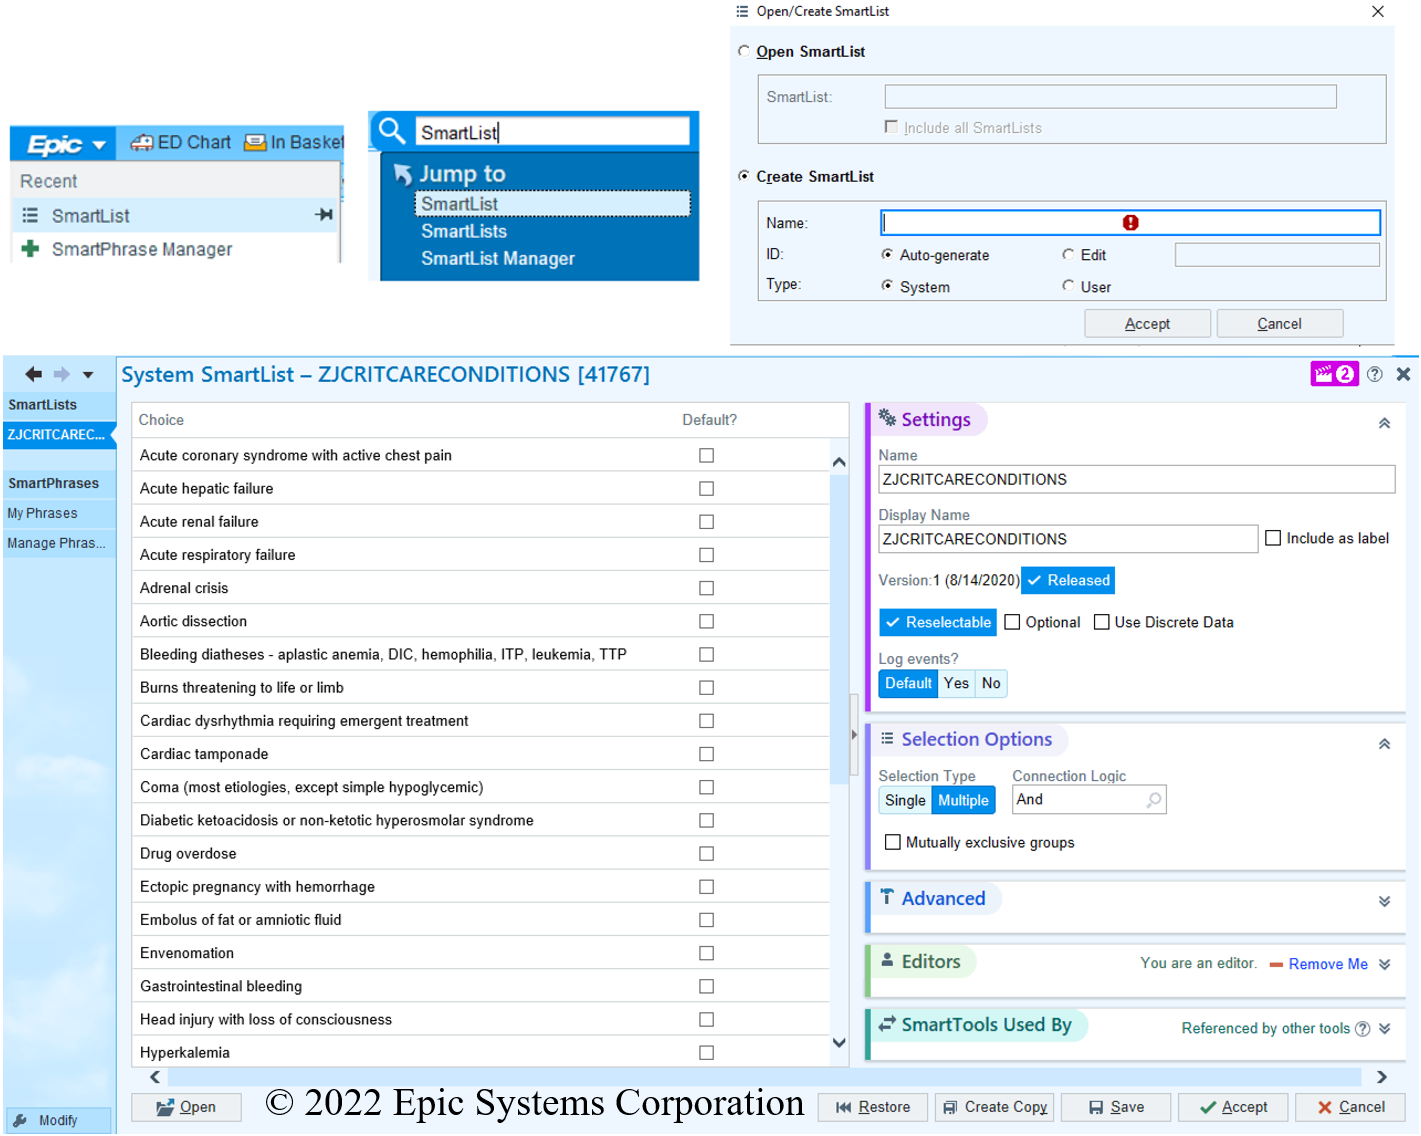
Figure 4. Example of a SmartList
Users can create their own SmartLists by accessing the SmartList interface from the main Epic menu in the upper-left hand corner of their screen or by using the search bar in the upper-right hand corner to “Jump to” SmartList. After creating a name for your new SmartList, enter the choices that you’d like to see displayed, indicate whether any of the choices should be selected by default, indicate whether the list should allow a single or multiple selections, and be sure to click the “release” button before saving, otherwise your SmartList will not be able to be used.
Figure 5. Creating Your Own SmartLists
NoteWriter Macros
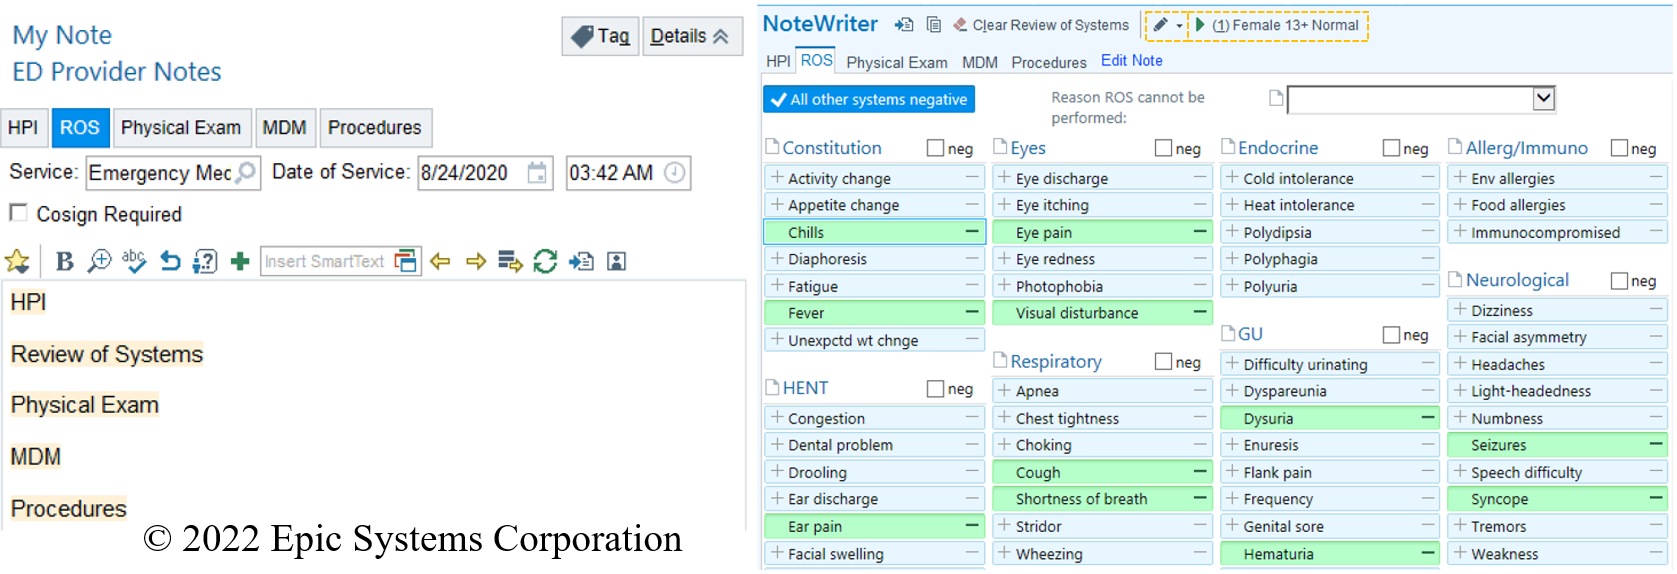
In addition to being able to populate the content of your note using free-text, SmartPhrases, SmartText, SmartLists, and voice transcription, Epic also includes a NoteWriter tool that allows point-and-click documentation. Macros allow you to automatically select certain buttons within the NoteWriter template and different macros can be created for certain combinations of age, gender, chief complaint, etc. If you manually select options prior to applying the macro, the macro will not overwrite your manual selections.
Figure 6. Using and Creating NoteWriter Macros
To use NoteWriter, your note must contain special orange-highlighted SmartTexts that create buttons at the top of your note that allow you to jump to the NoteWriter activity of interest.
You can save a new macro by selecting the pencil icon within any NoteWriter activity, and you can apply a macro using the green play-buttons that will appear next to the pencil icon.
Customize Your ED Trackboard
The trackboard is an essential way to know which patients are in your ED, where they are located, who is caring for them, their current condition, and where they are at in the course of their work-up. A trackboard with too many columns is information overload and may limit your ability to focus on what is essential, especially if column widths are so narrow as to not allow you to easily read their contents. A trackboard with too few columns may be missing information that could serve as helpful mental prompts about tasks that need to be completed or cue you into the severity of a patient’s condition or make it easier to know who is part of each patient’s care team.
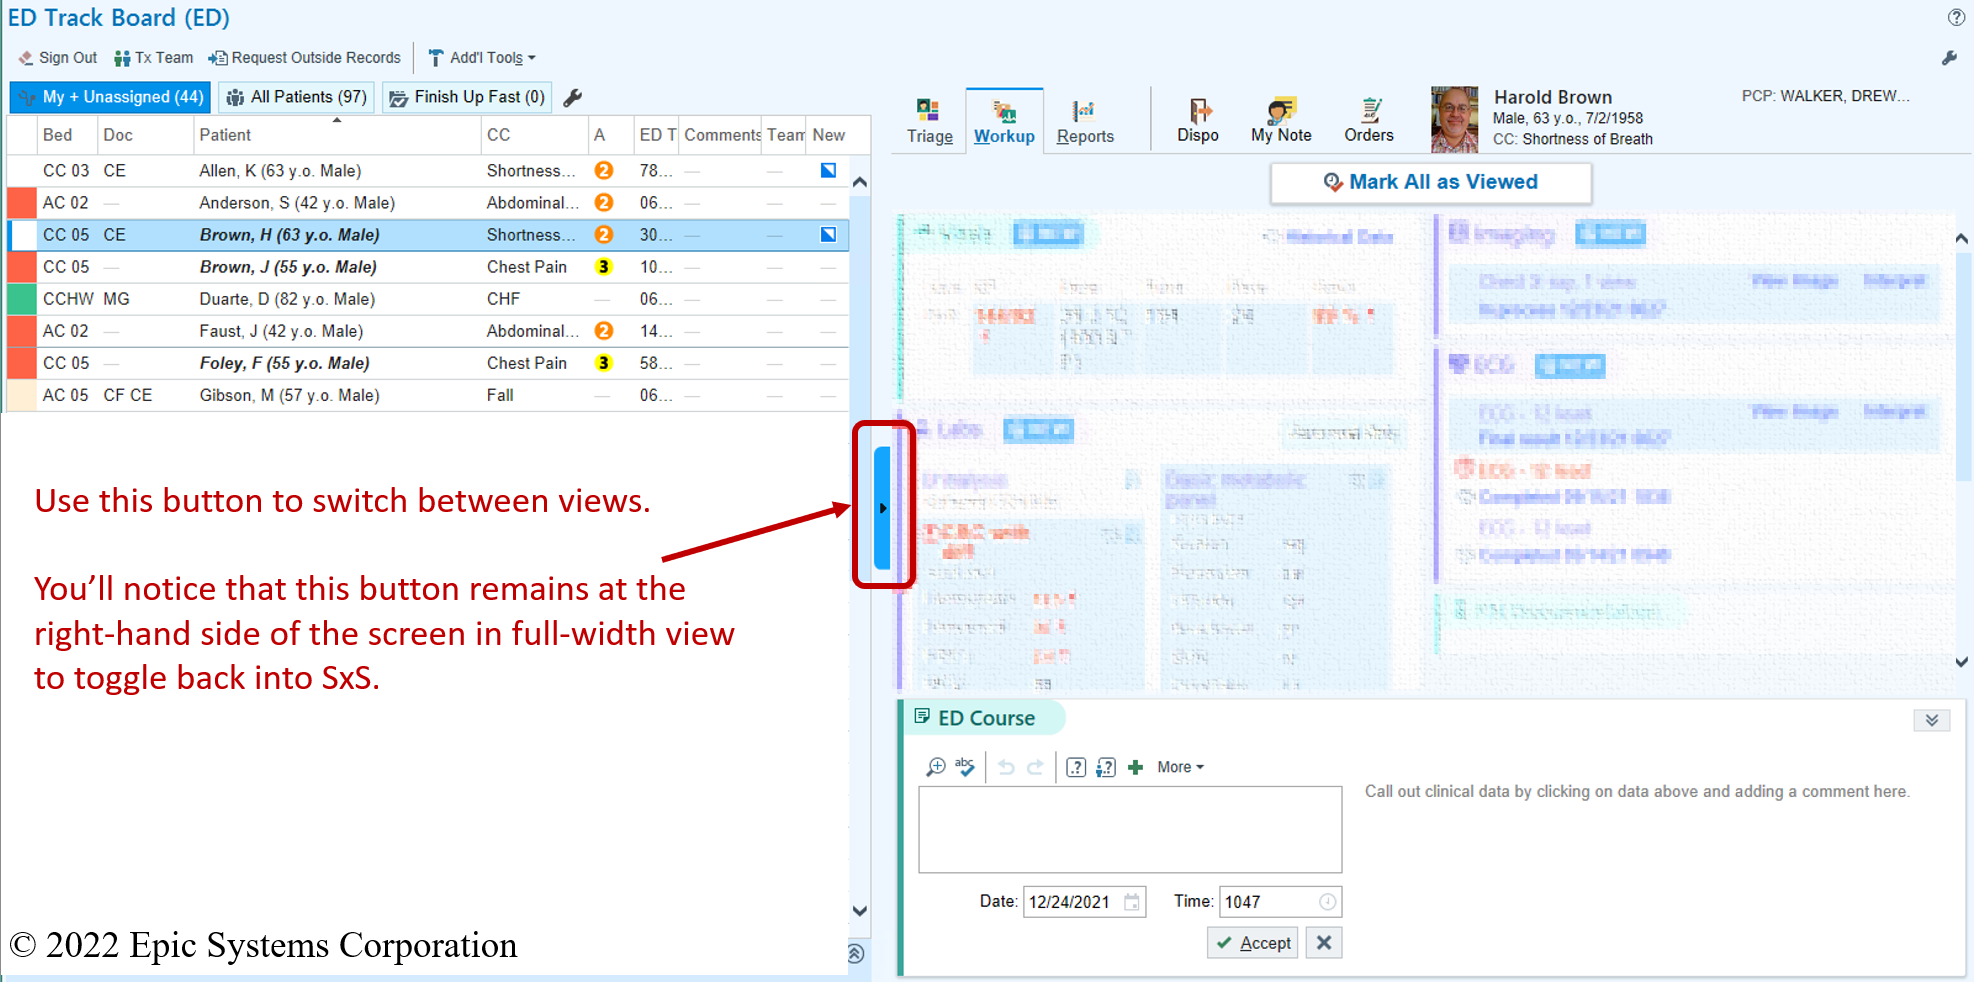
There are two ways to view the ED trackboard, traditional full-width or a newer, side-by-side view that allows access to significantly more information and functionality without having to leave the trackboard and open a patient’s chart. You can toggle between the two trackboard views using an arrow button that will either be in the middle of the screen while in the side-by-side view or at the right-edge of the screen while in full-width view.
Figure 7. Toggling Between Full-Width and Side-by-Side Trackboard Views
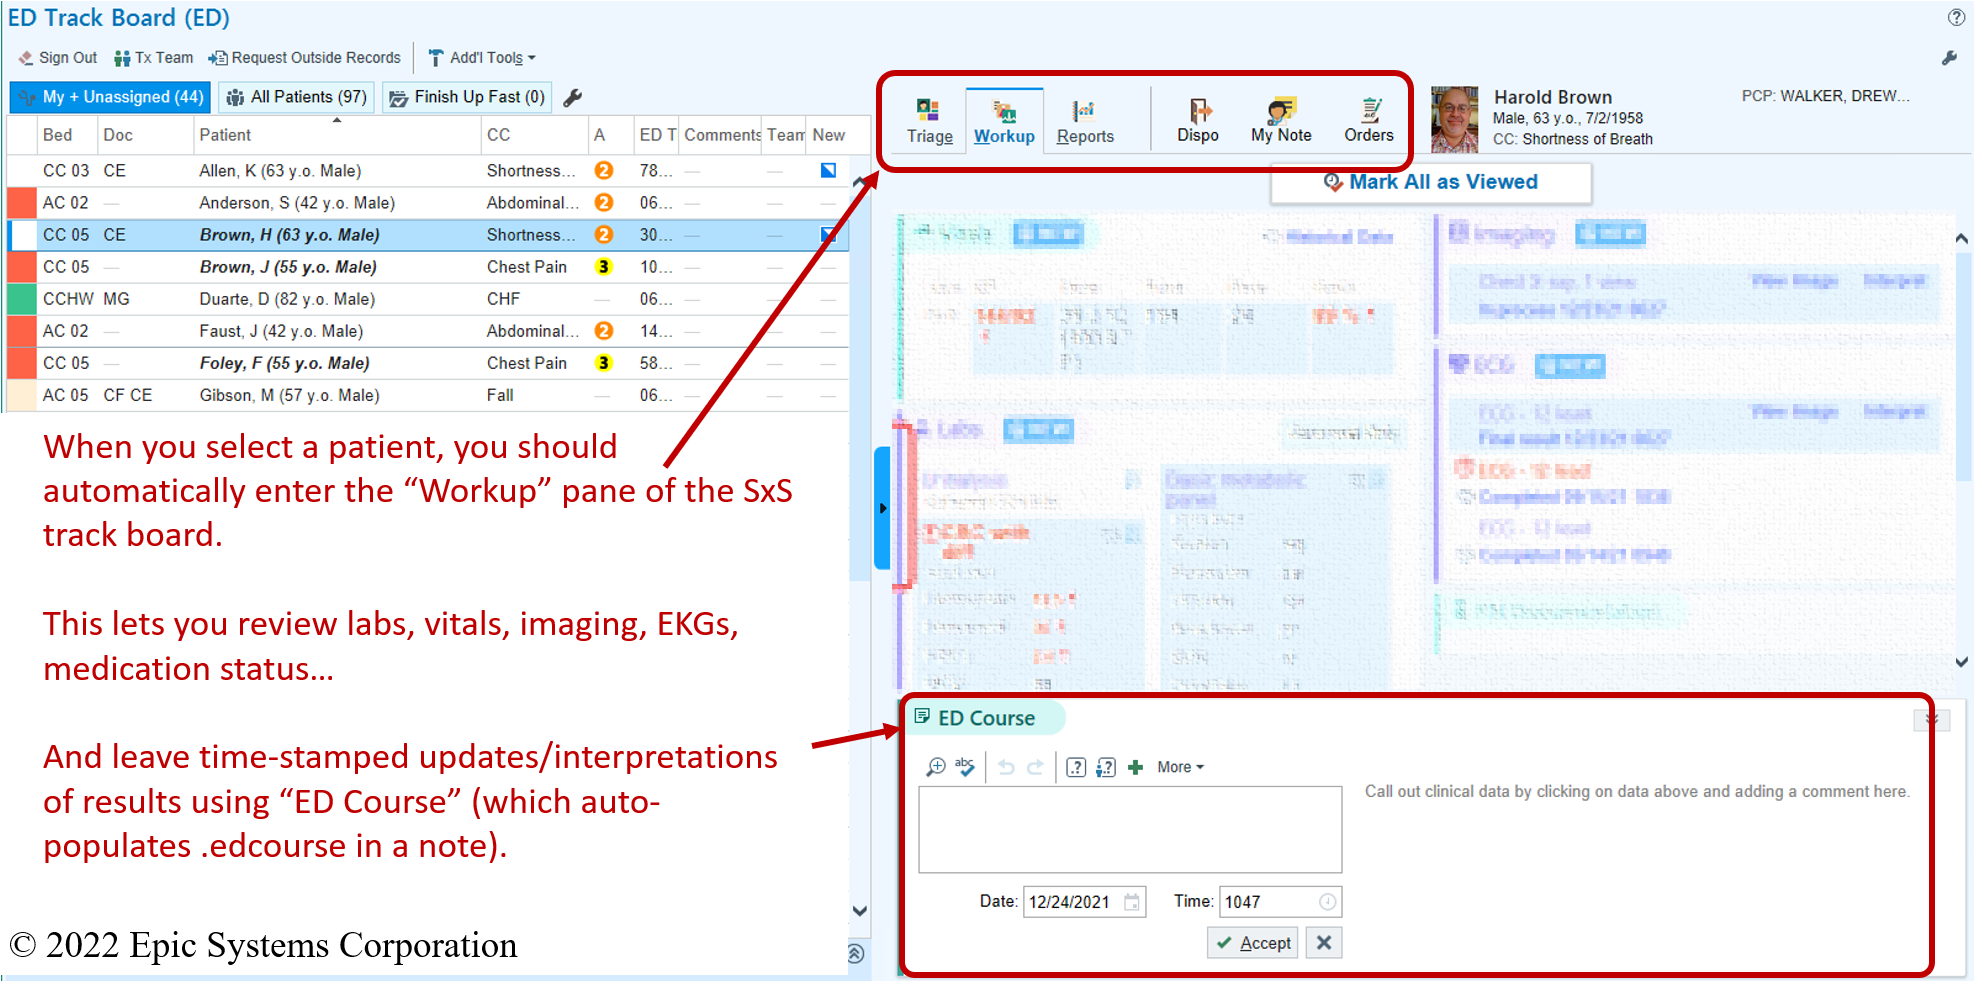
From within the side-by-side trackboard, you can see a patient’s past medical history, medications, vital signs, triage note, results, and even add time-stamped updates to the patient’s ED course which can be automatically included in your note by using the .edcourse SmartPhrase in your note template.
Figure 8. Enhanced Functionality of Side-By-Side Trackboard
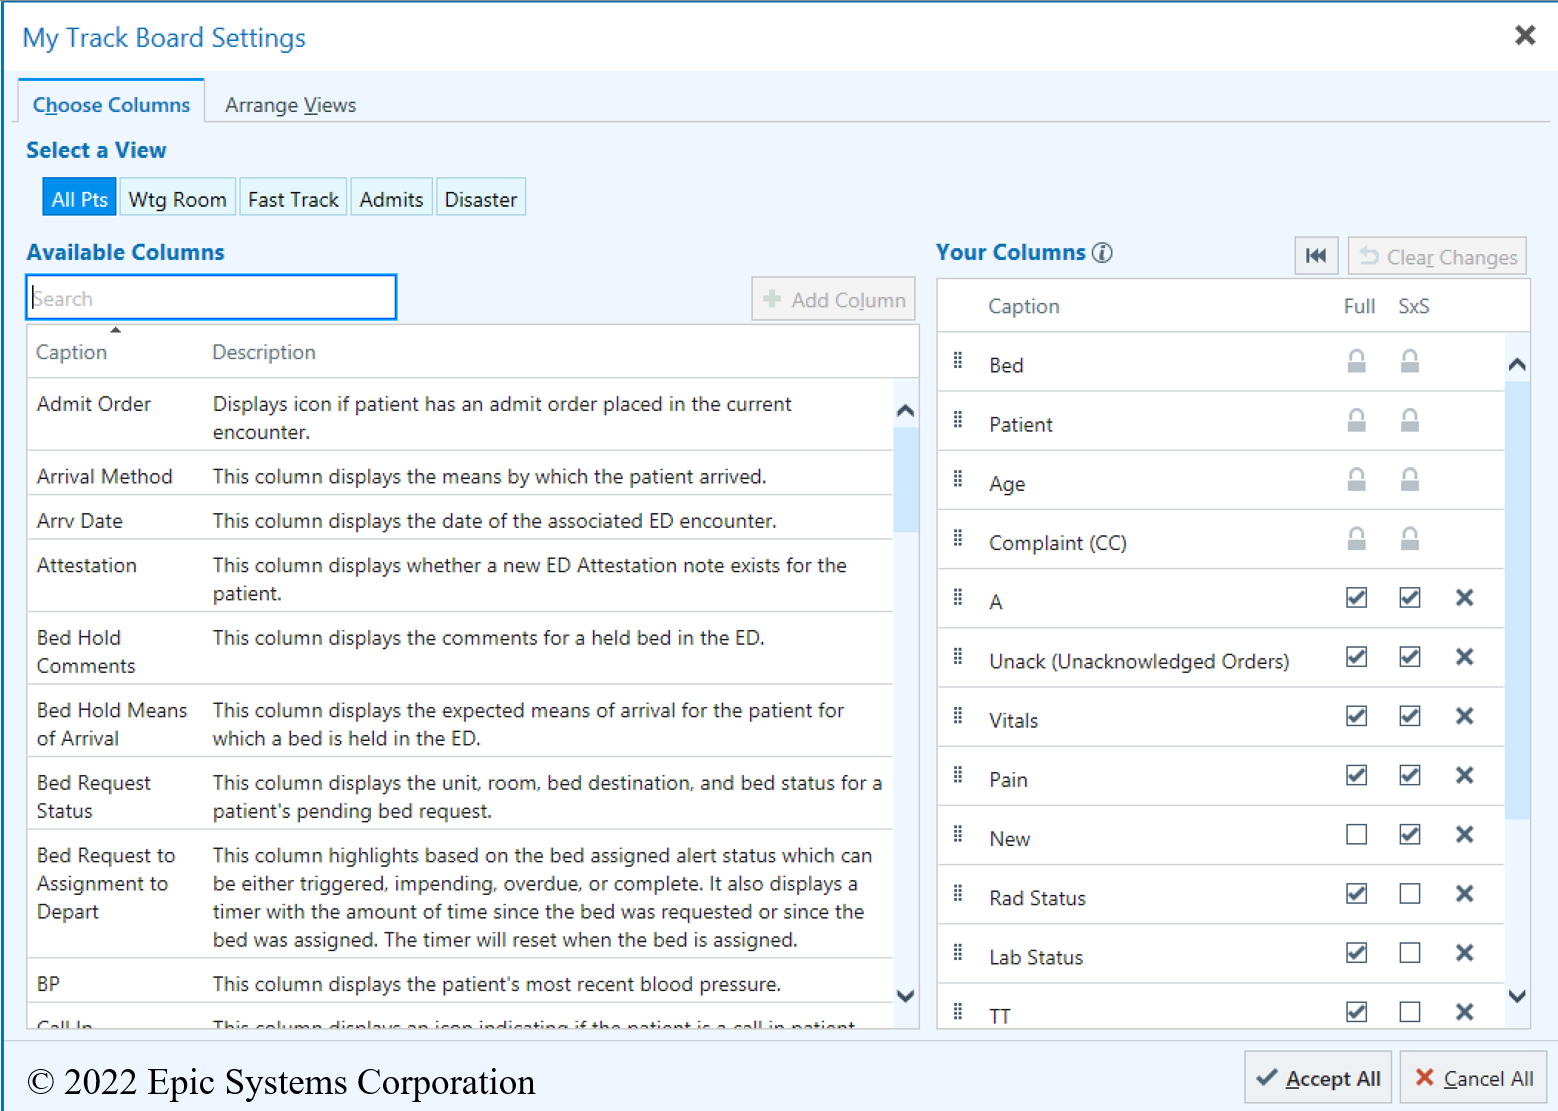
In the past, all users of a certain type (physicians, residents, nurses, techs) had the same fixed trackboard views, however since the February 2019 release of Epic, many organizations now let physicians customize which columns show up on each view of their trackboard. This can be done by clicking the wrench icon at the right-hand side of the ED trackboard screen. In the first tab, you can select which columns you want displayed on the full or side-by-side (SxS) trackboards for a given view. In the second tab, you can arrange the order or hide certain trackboard views from automatically displaying. Your organization may require certain columns to always be displayed (these will appear with a lock icon) and you are only able to add columns that your organization has decided to make available to you.
Figure 9. Trackboard Personalization
Locate Outside Hospital Records Using CareEverywhere
Emergency physicians are used to having to make life or death decisions based upon limited information, but it’s always nice to have information when it’s available. While Epic can be configured to link to external health information exchanges, you can easily view patient information from other Epic organizations using CareEverywhere. For the most part, linking a patient’s records across Epic organizations is not an automated process, it requires querying specific organizations where the patient has been seen. Organizations must be individually queried to make matches, just because you see some organizations listed in CareEverywhere, doesn’t mean there aren’t others. If the demographic information closely matches between organizations, a match will be automatically suggested (meaning that you are not likely to find matches before patients are registered or patients who are undomiciled, do not have social security numbers, or have recently changed mailing addresses or phone numbers).
Figure 10. Using CareEverywhere
There are several ways that you can access a patient’s information from other organizations if the charts are already linked:
- Click the CareEverywhere icon at the top of the storyboard on the left-hand side of the screen
- From the Encounters tab of Chart Review
- Using the drop-down arrow at the far right hand side of the tabs within a patient’s chart
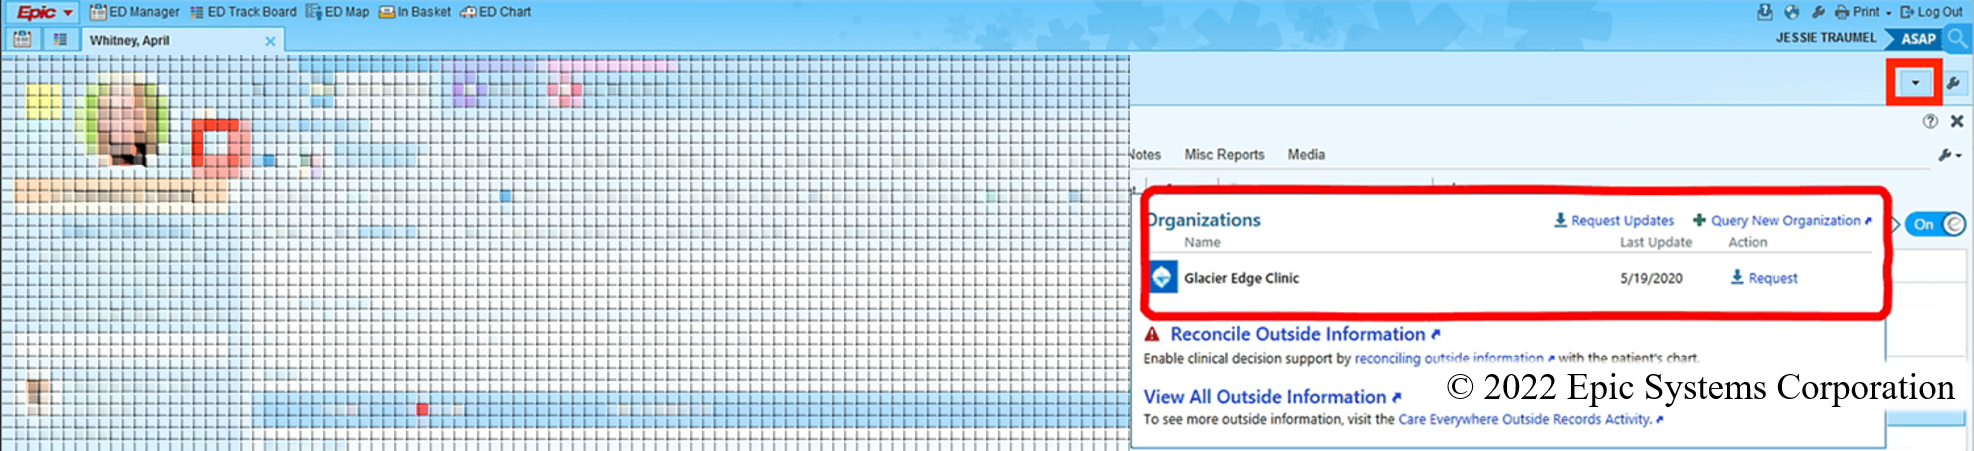
If a patient is not currently linked to any outside organizations, you may not see the CareEverywhere icon in the storyboard or be able to access the CareEverywhere tab in a patient’s chart. In these instances, you will want to search for “Request Outside Records” or find this using the drop-down arrow to the right of the tabs in a patient’s chart. From here, you can search for new organizations to match a patient’s chart with.
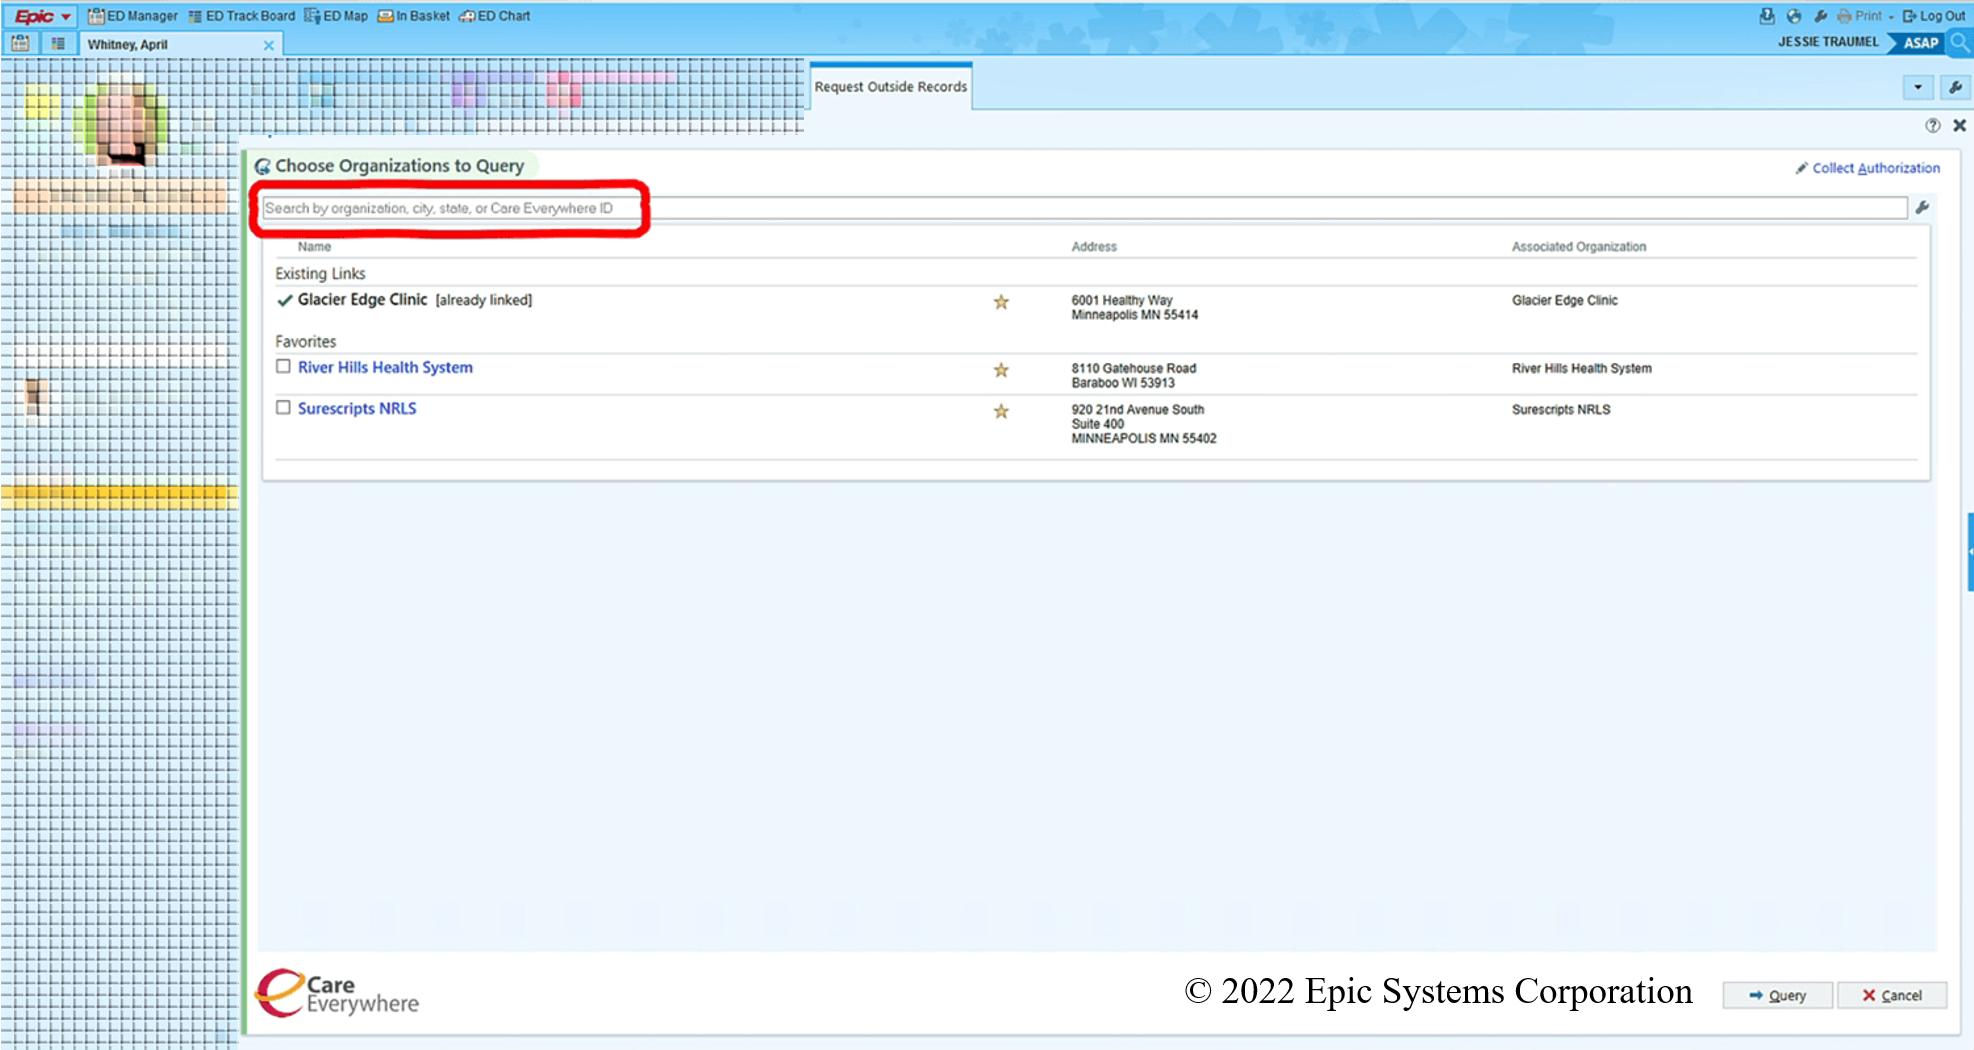
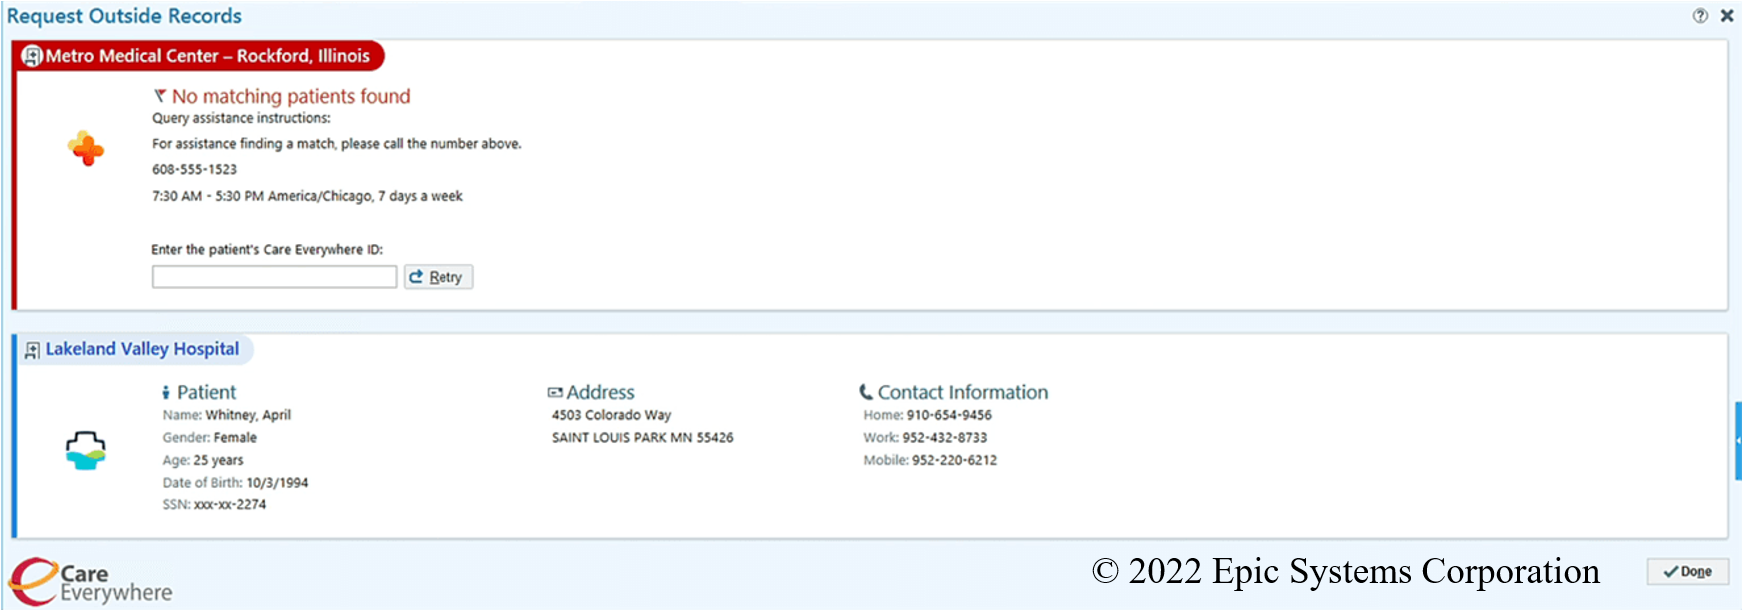
As previously mentioned, if the demographic information registered differs between the two organizations, an automatic match will not be made. However, many organizations list a phone number that you can call to request a patient’s Care Everywhere ID, which if entered in the box displayed on the screen can manually match the charts despite different demographic information.
Watch the Epic weLearning Video to see this process in action.
Create Order Panels & Save Order Preferences
Some organizations may have created order panels available for all physicians to use to help expedite placing certain bundles of orders. If your organization has not created these, or you would like to create personalized versions for yourself.
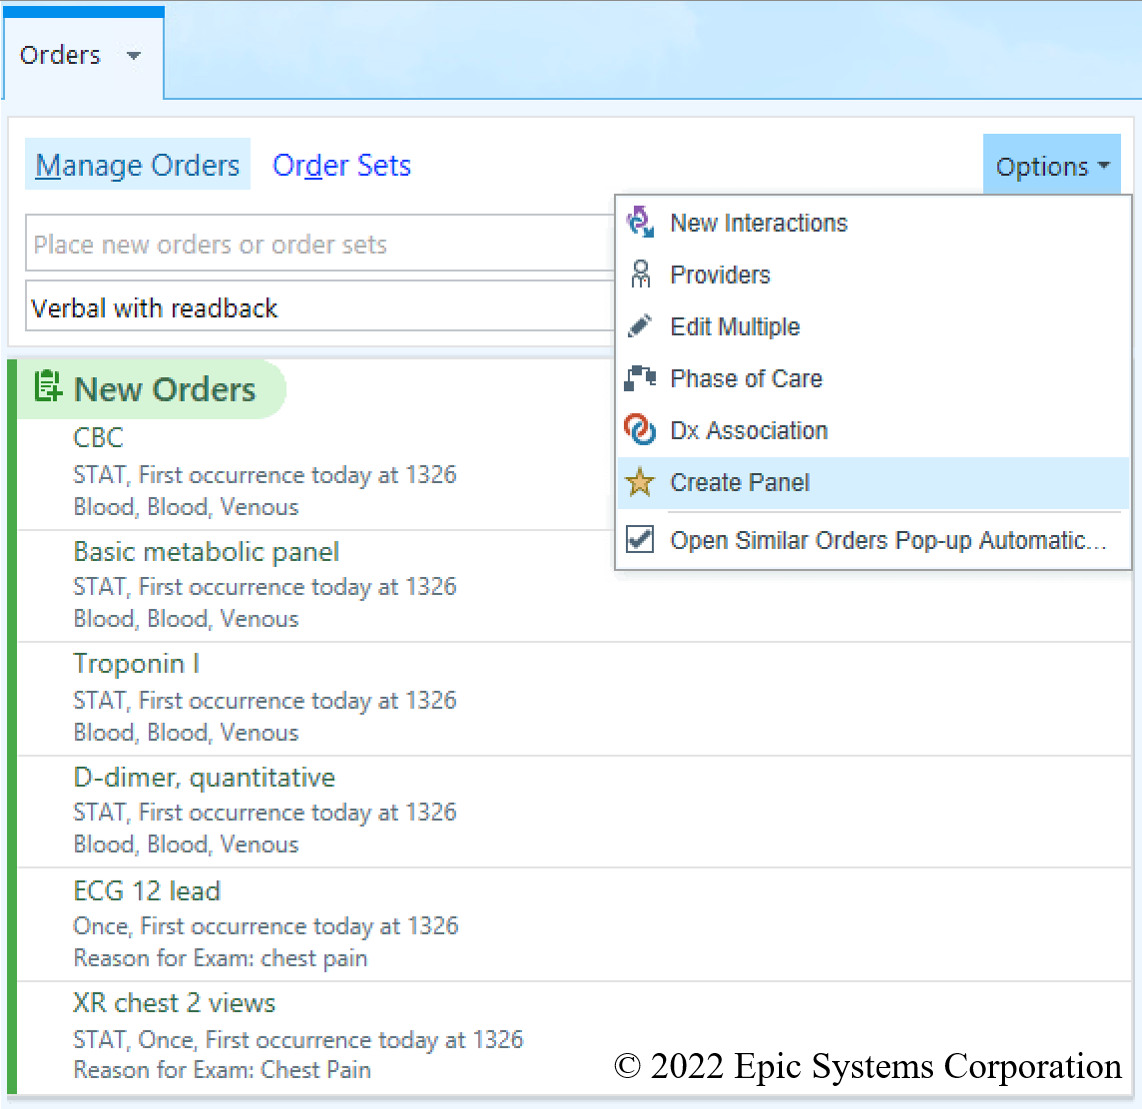
Figure 11. Creating Order Panels
First, within any patient’s chart. Enter a list of orders that you might frequently place together. From the “Options” drop-down menu, select “Create Panel.”
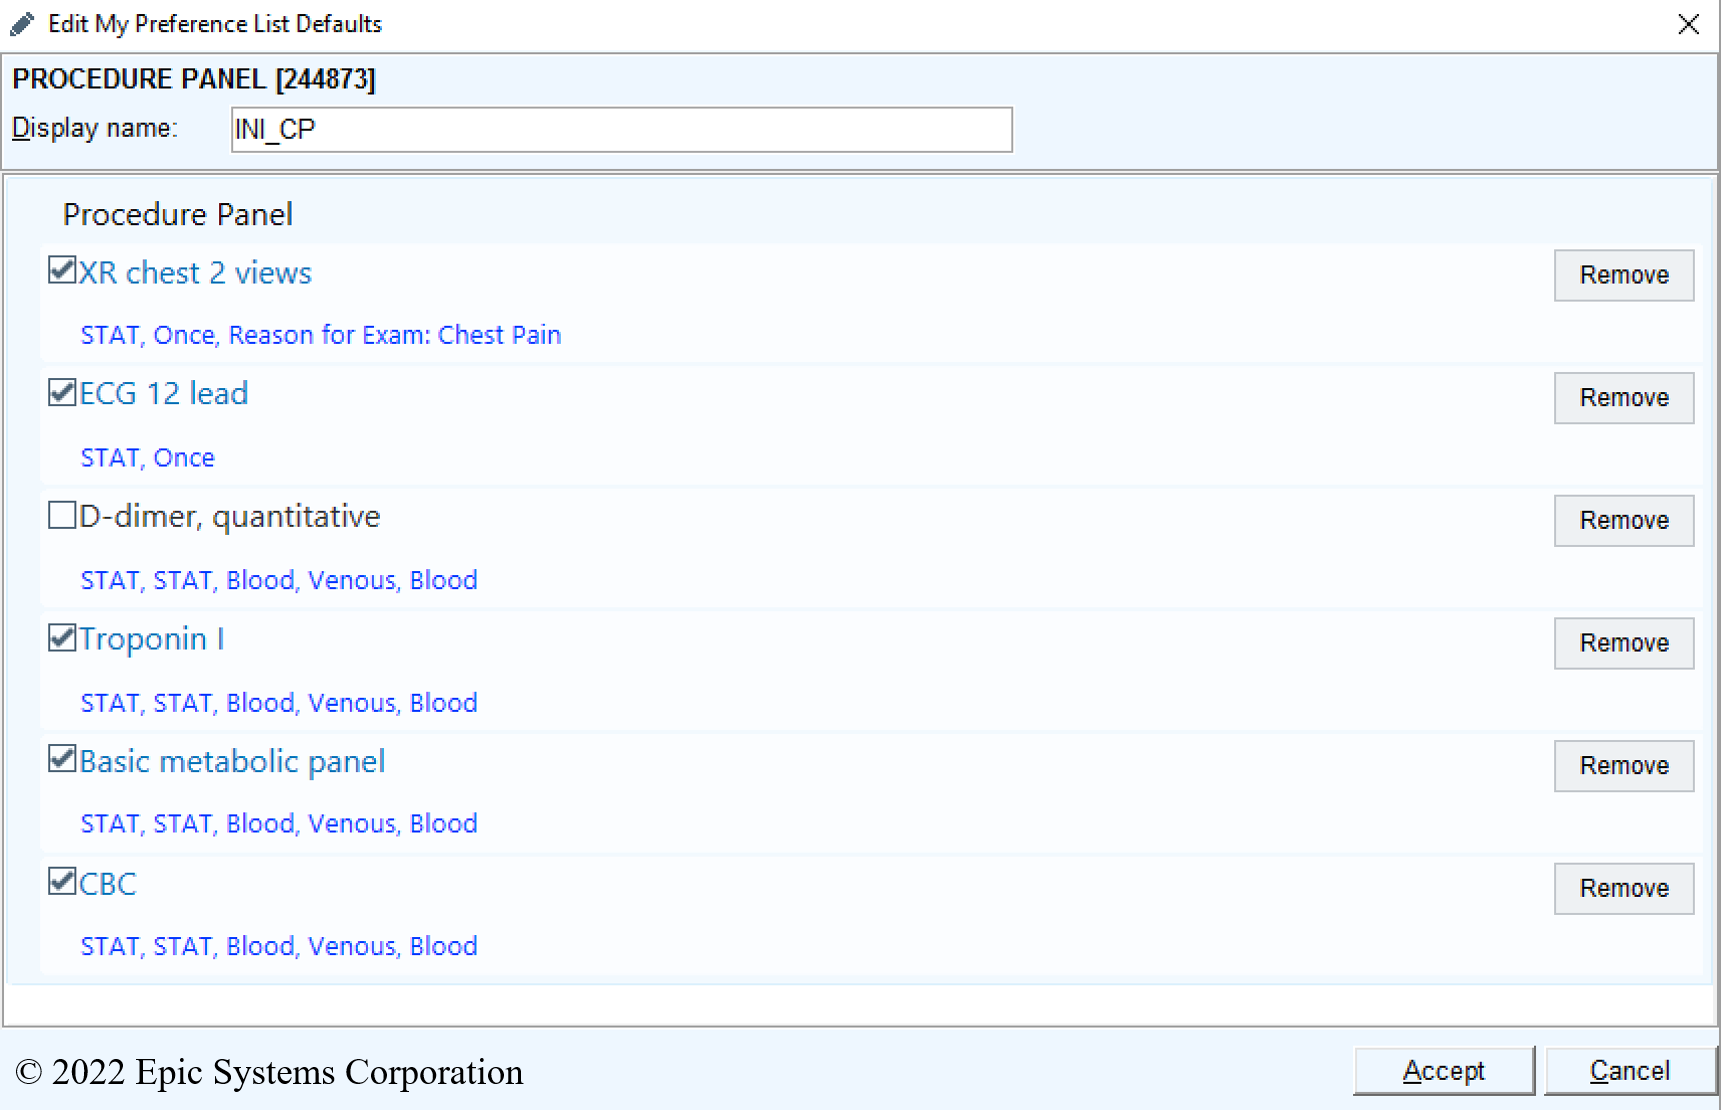
Next, you will be taken to a screen that allows you to name the panel (a short name with your initials and the scenario where you would use the panel is ideal so that you can fully type the name of the panel as an order and avoid having to search/select the panel, ie: INI_CP for chest pain). You can also unselect orders that you don’t want to be selected by default, such as a d-dimer, and you can go into each order and type the indications for EKGs and imaging since these aren’t automatically carried over when you create the order panel.
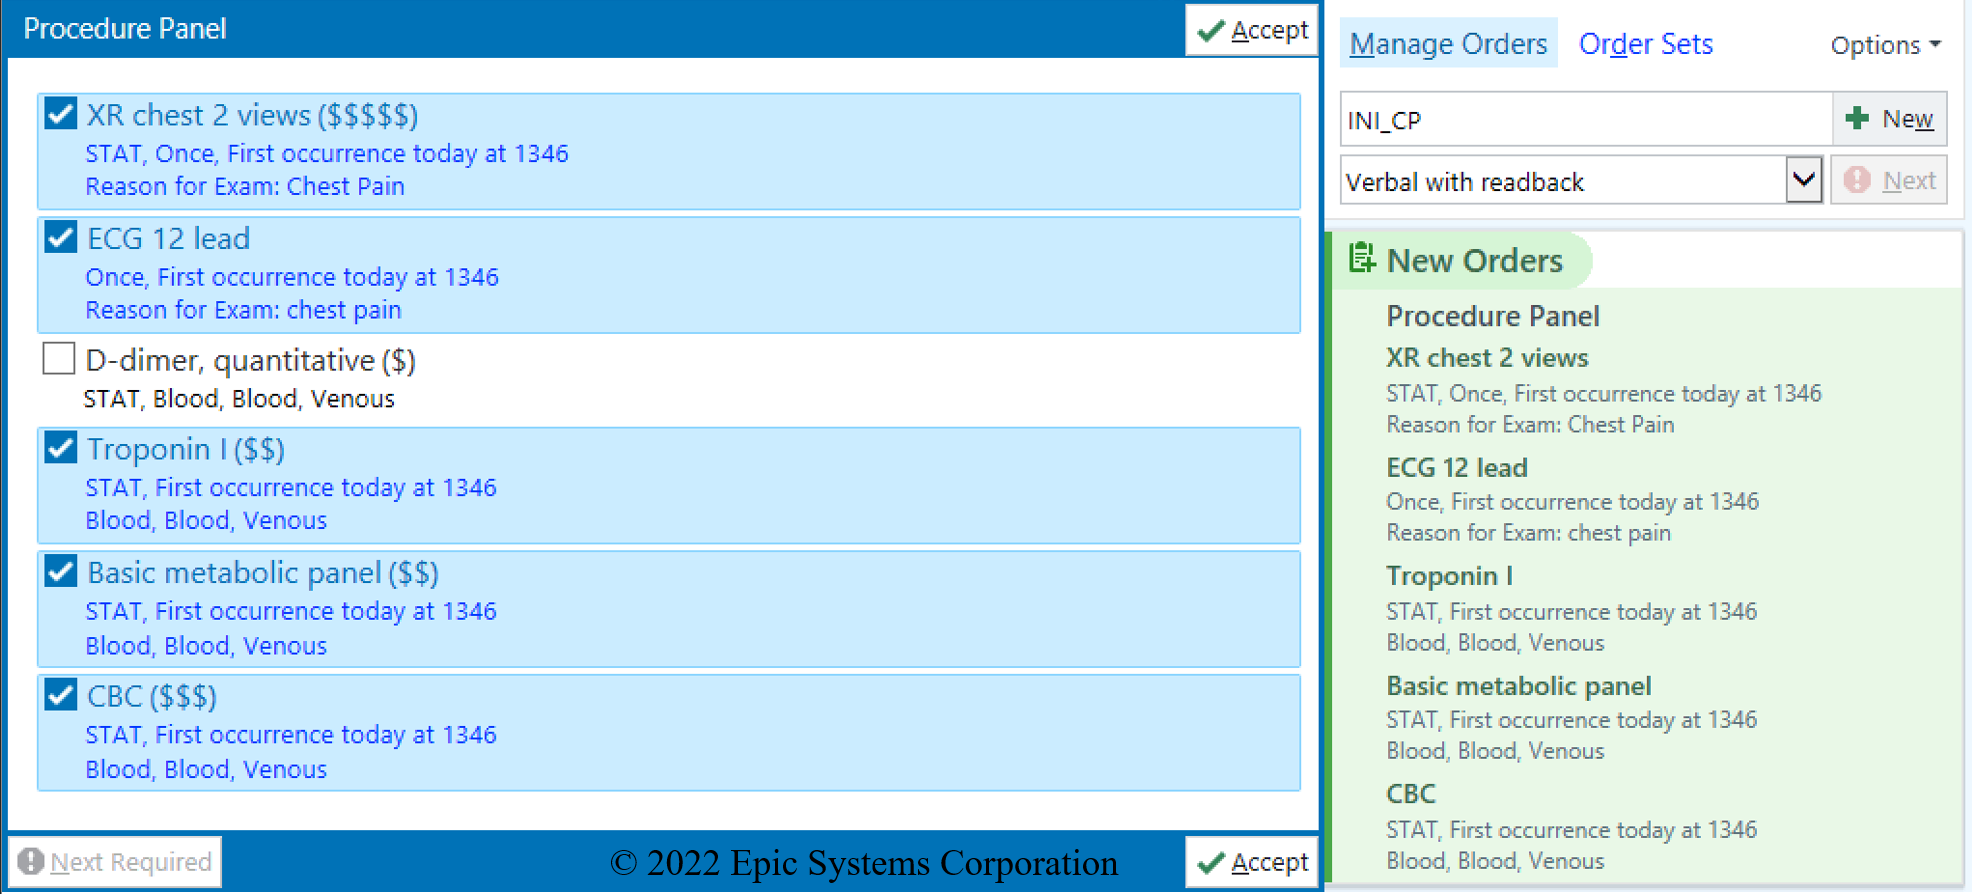
Finally, test your order panel by typing its name as an order (ie: INI_CP).
Many organizations have created orders that automatically select common doses, frequencies, and durations of treatment for medications. If your organization has not created these, you can create your own customized orders.
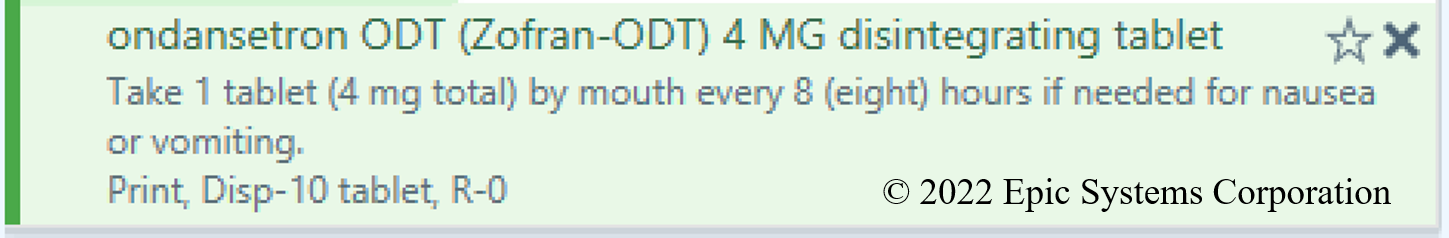
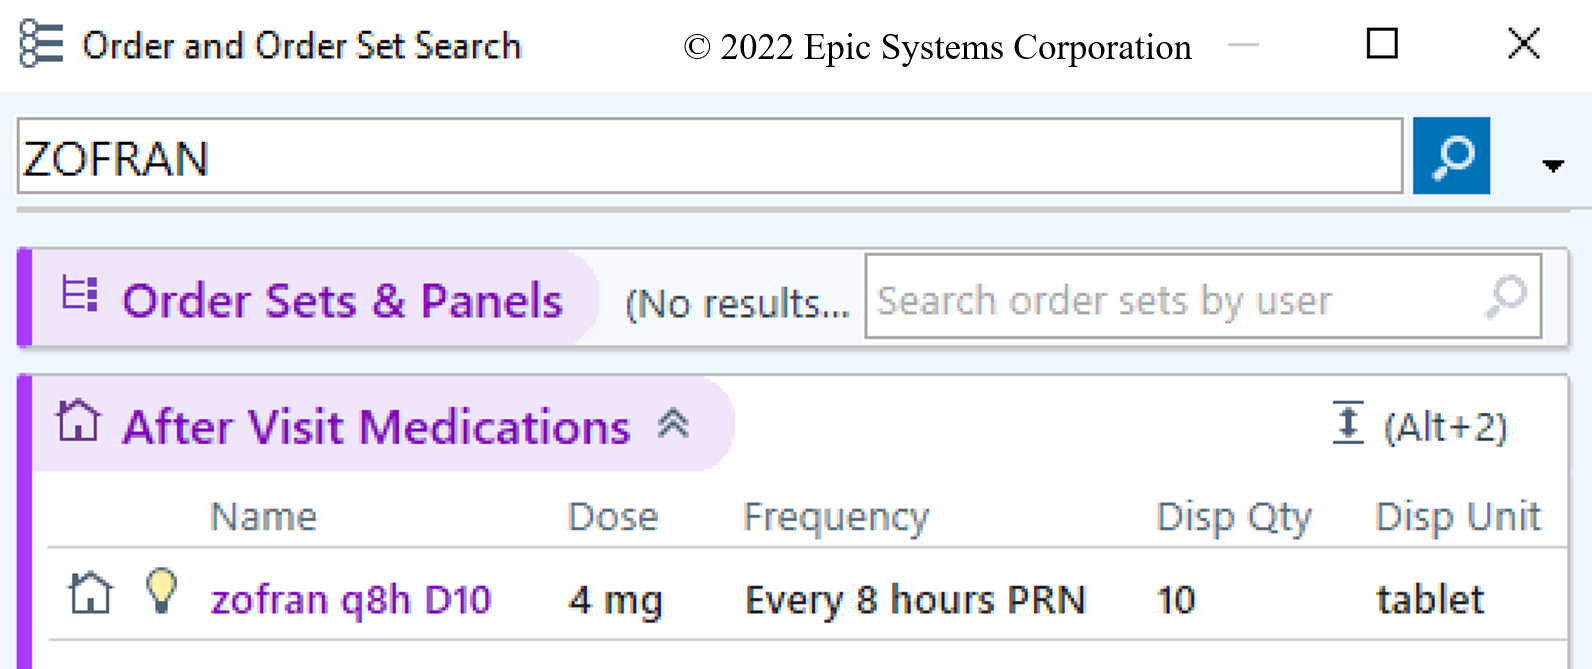
Figure 12. Saving Order Preferences
For instance, if when ordering Zofran at discharge you always have to type that you want to dispense 10 tablets to be taken every 8 hours as needed for nausea, once you have completed those details within a patient’s chart, you can click the “star” icon to make this a favorite.
You can then name the order with these saved preferences.
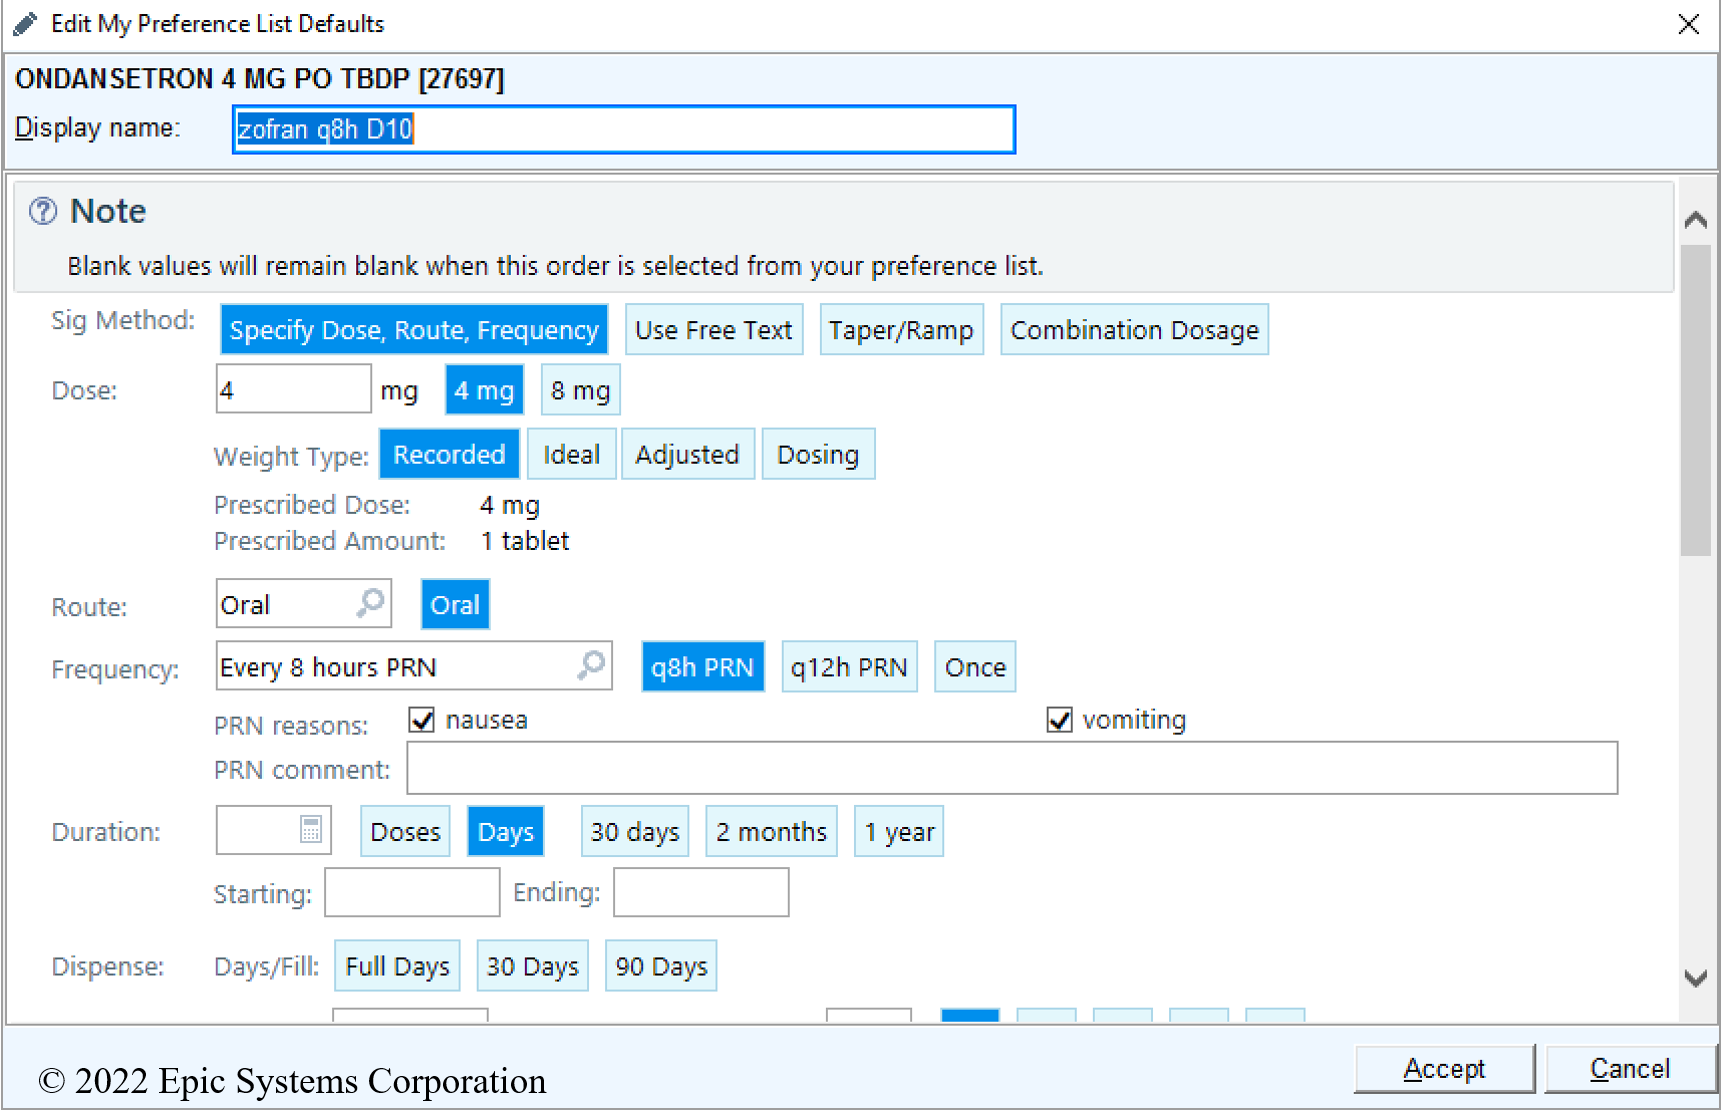
And the next time you search for “Zofran” at discharge, your customized order will appear.
Reporting
The two primary reporting tools available to Epic users (depending upon your organization’s default security settings) are:
- Reporting Workbench: Allows patient-level detail and customization of what information shows up on a report about each patient, but reports are frequently limited to short intervals such as 30 days at a time (though you can run the report several times over different 30 day time intervals). The results generated for reports can be exported as spreadsheets for further analysis.
- SlicerDicer: Does not provide patient-level detail, however it can provide trends over much longer time periods, such as looking at monthly changes in patient volume over a several year period, or looking at which BestPractice Advisories are generating the most alerts over the past year.
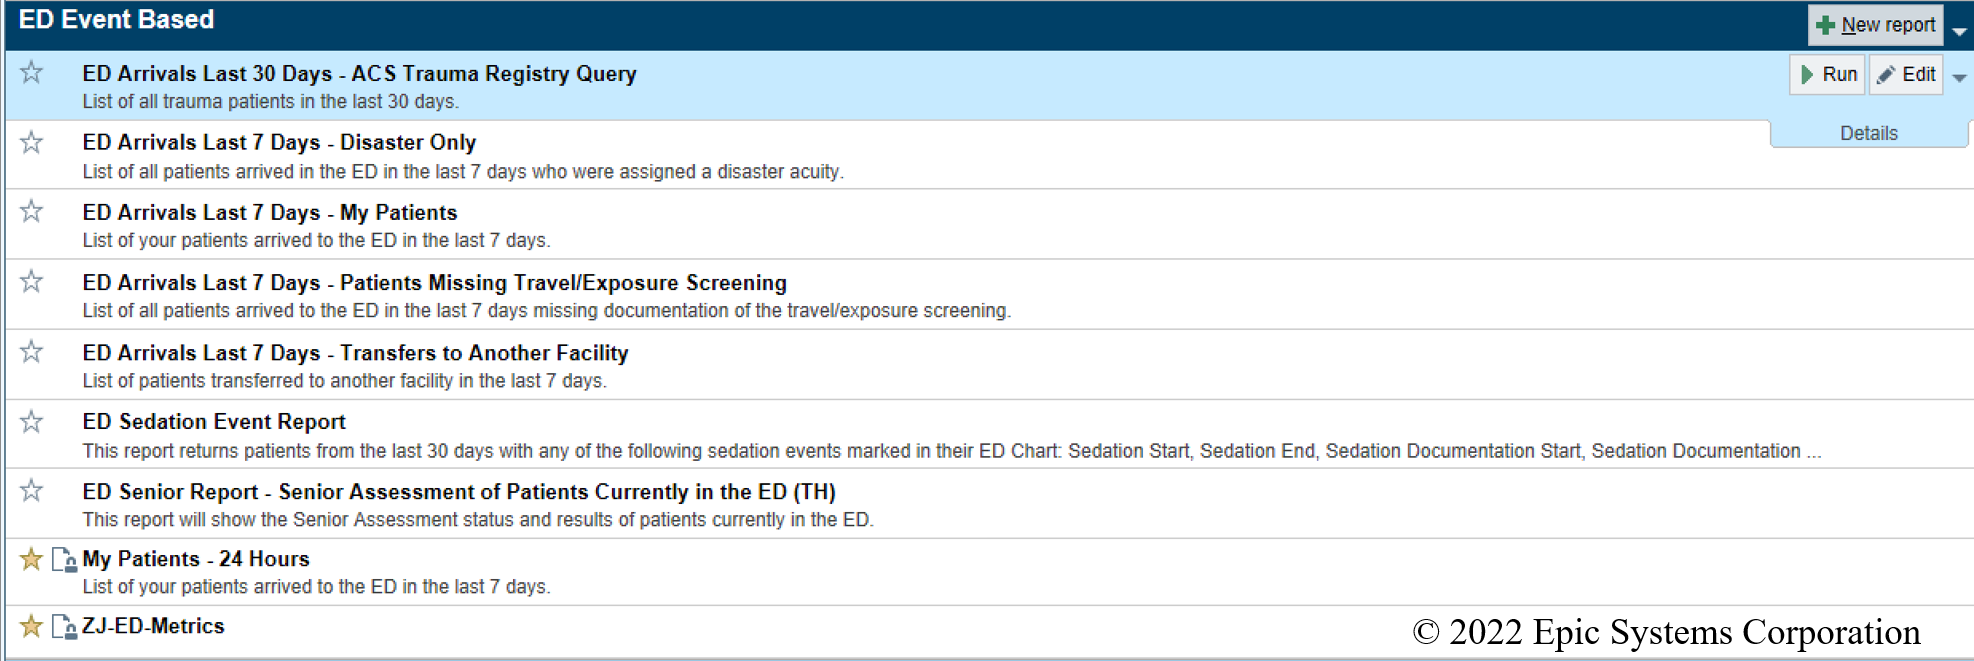
Figure 13. Using the Reporting Workbench
To access the reporting workbench, you can either search for “My Reports” in your top navigation bar, within the “Epic” menu at the top-left, or use the search tool at the top-right of your screen to “Jump To” “My Reports”. Within the Reports tab, select “Library” in the left-hand navigation bar to see a list of reports that are available to you.
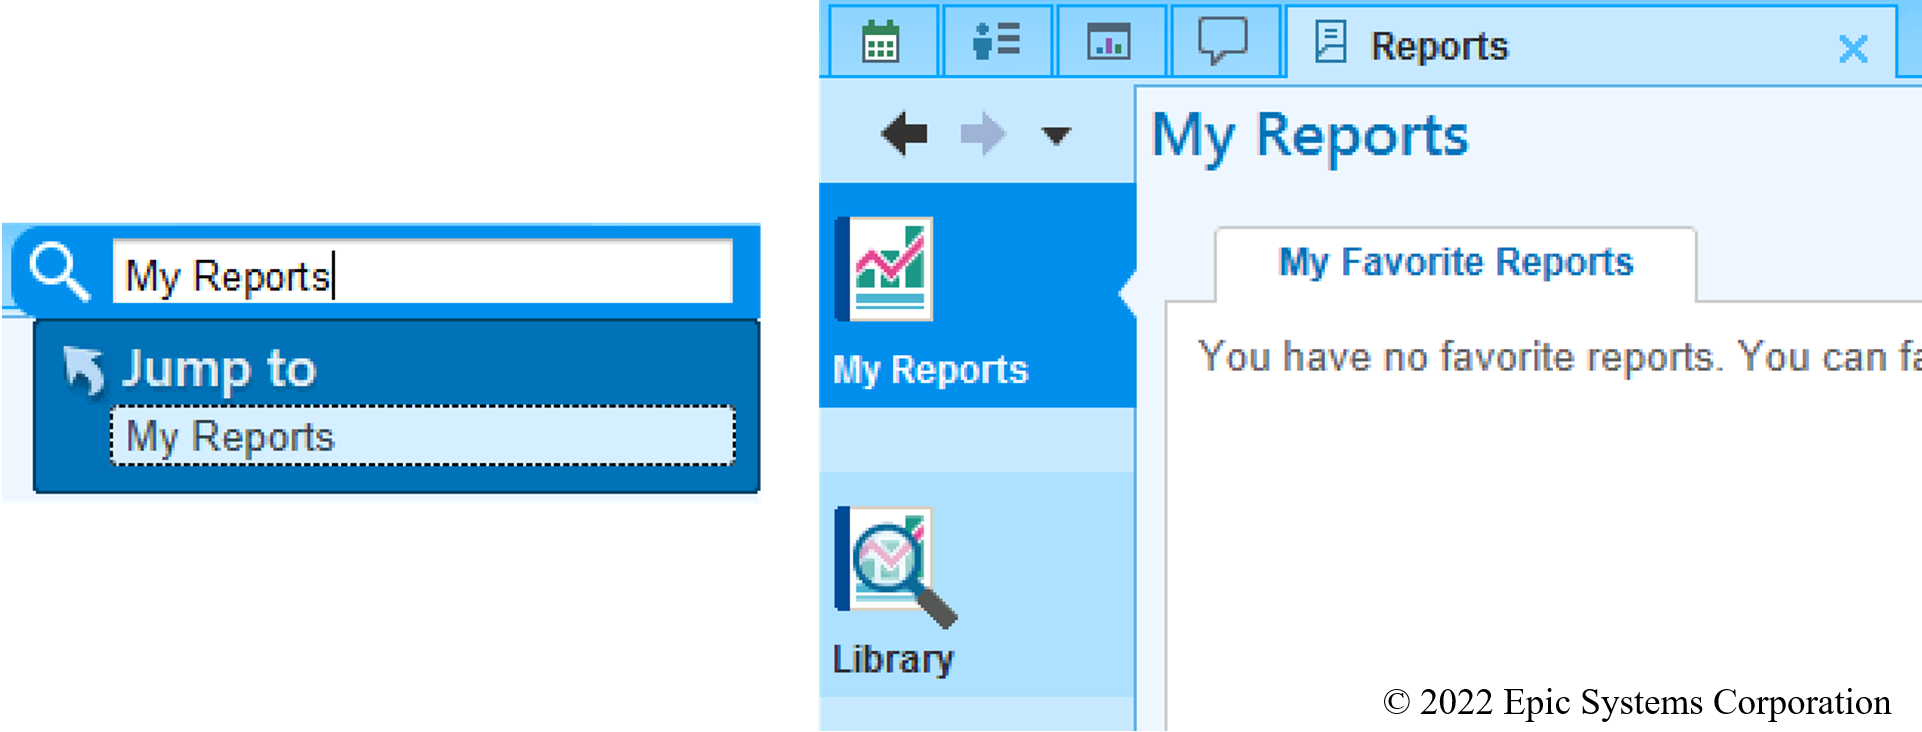
Within the library, you may see several "types" of reports organized into sub-headers. Some search orders, some search ED events, etc. There are known as "report templates." You can click the star next to a report type to add it to your list of favorites. When hovering over each report, you will also see options to “Run” or “Edit” the report. You can saved edited reports under a new report name (for instance, if your organization only has a report to show you the patients that you’ve seen in the last 7 days, but you’d like to be able to filter patients that you’ve seen in the last 24 hours, you could edit the existing 7 day report). If you would like to create a new report from scratch using a given report template, hover over the dark-blue sub-header and click "New report".
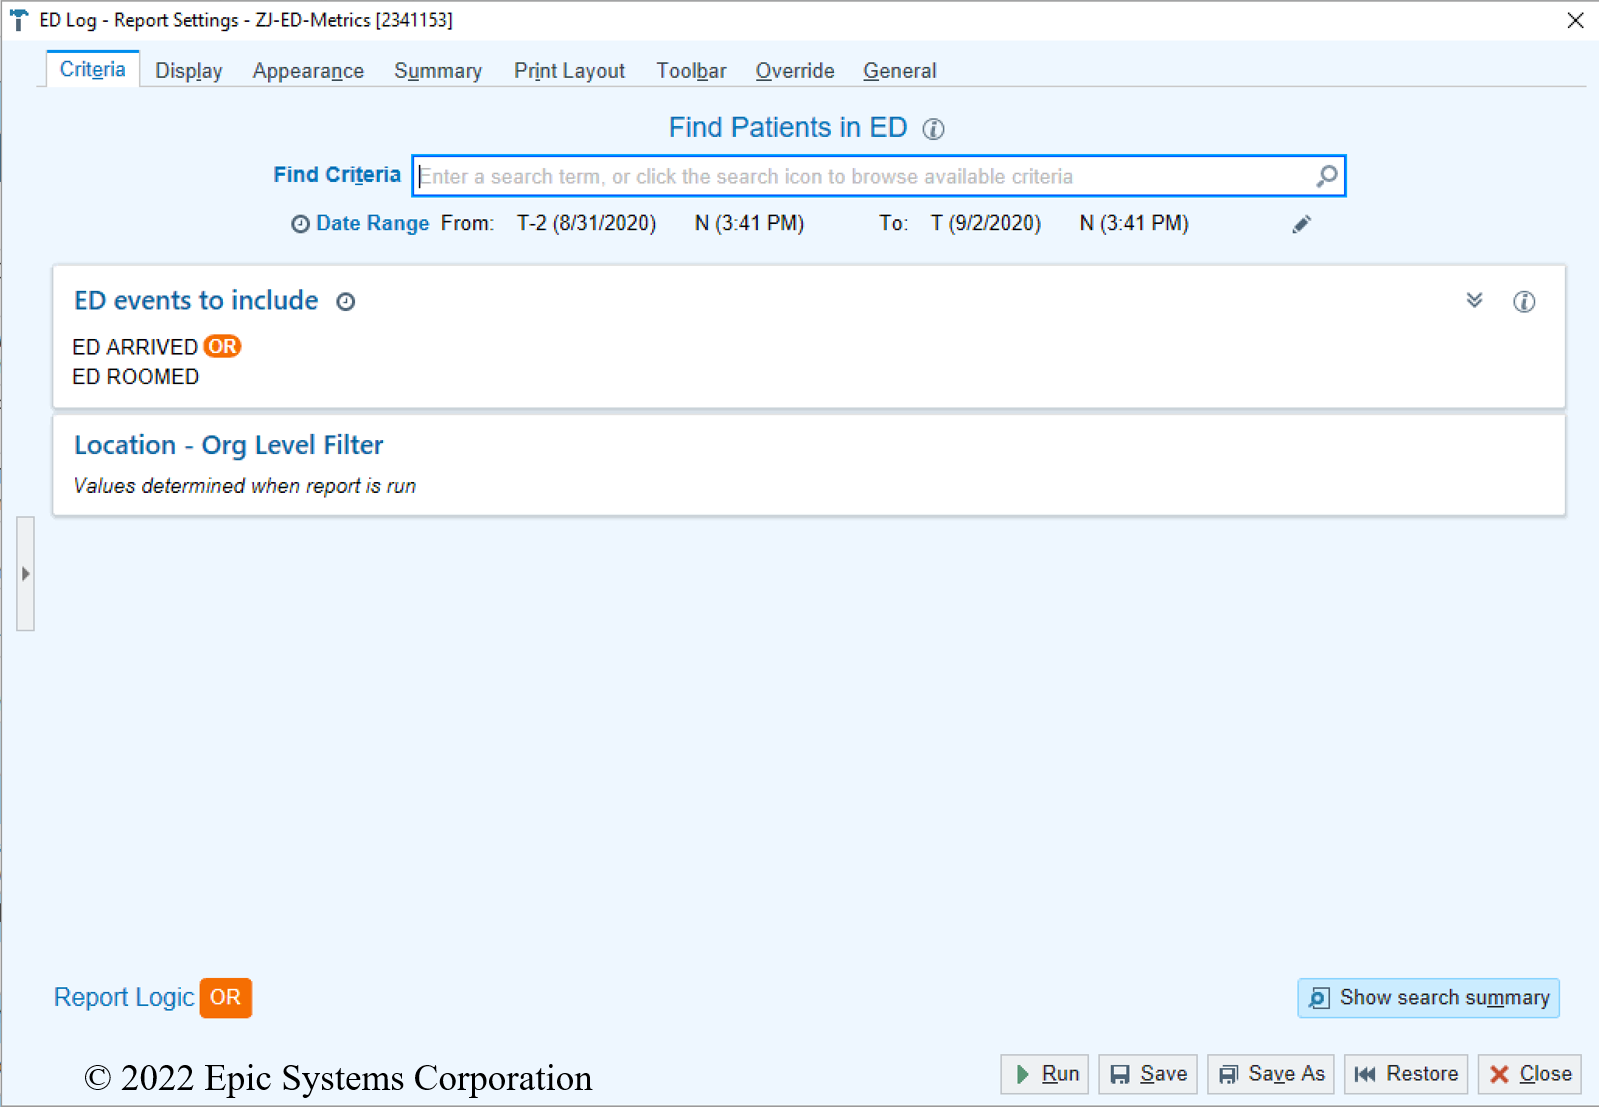
The first tab of report settings defines criteria for the search (time period, inclusion, exclusion, etc). In this example, we will look for all patients seen in the past 48 hours who were “arrived” or “roomed” in the emergency department.
The second tab of report settings determines which columns show up on the report. The "report template" has a default list of "available columns" that you can move back and forth between the "selected columns" using the arrows between the two lists.
There is also an "add" button beneath the list of "available columns" that lets you search for additional columns that are not part of the report template defaults. These "columns" can be used across multiple different places in Epic, including reports, track boards, etc, so it's important to know what the column is actually doing when adding them (ie: a trackboard column for attending would likely only show "active" attendings, whereas a reporting column would likely show all attendings ever assigned). For instance, you may be interested in finding a list of all of your patients in the past 48 hours that have incomplete notes, which you might be able to identify by finding a column that shows an icon for an incomplete note, or a timestamp for the last time that you signed a note for the patient, or a list of physicians who did sign a note for that patient. Once approach is to add all column instances somewhat related to the data point you’re looking for, compare the outputs after the report is run, then go back and remove the extraneous ones.
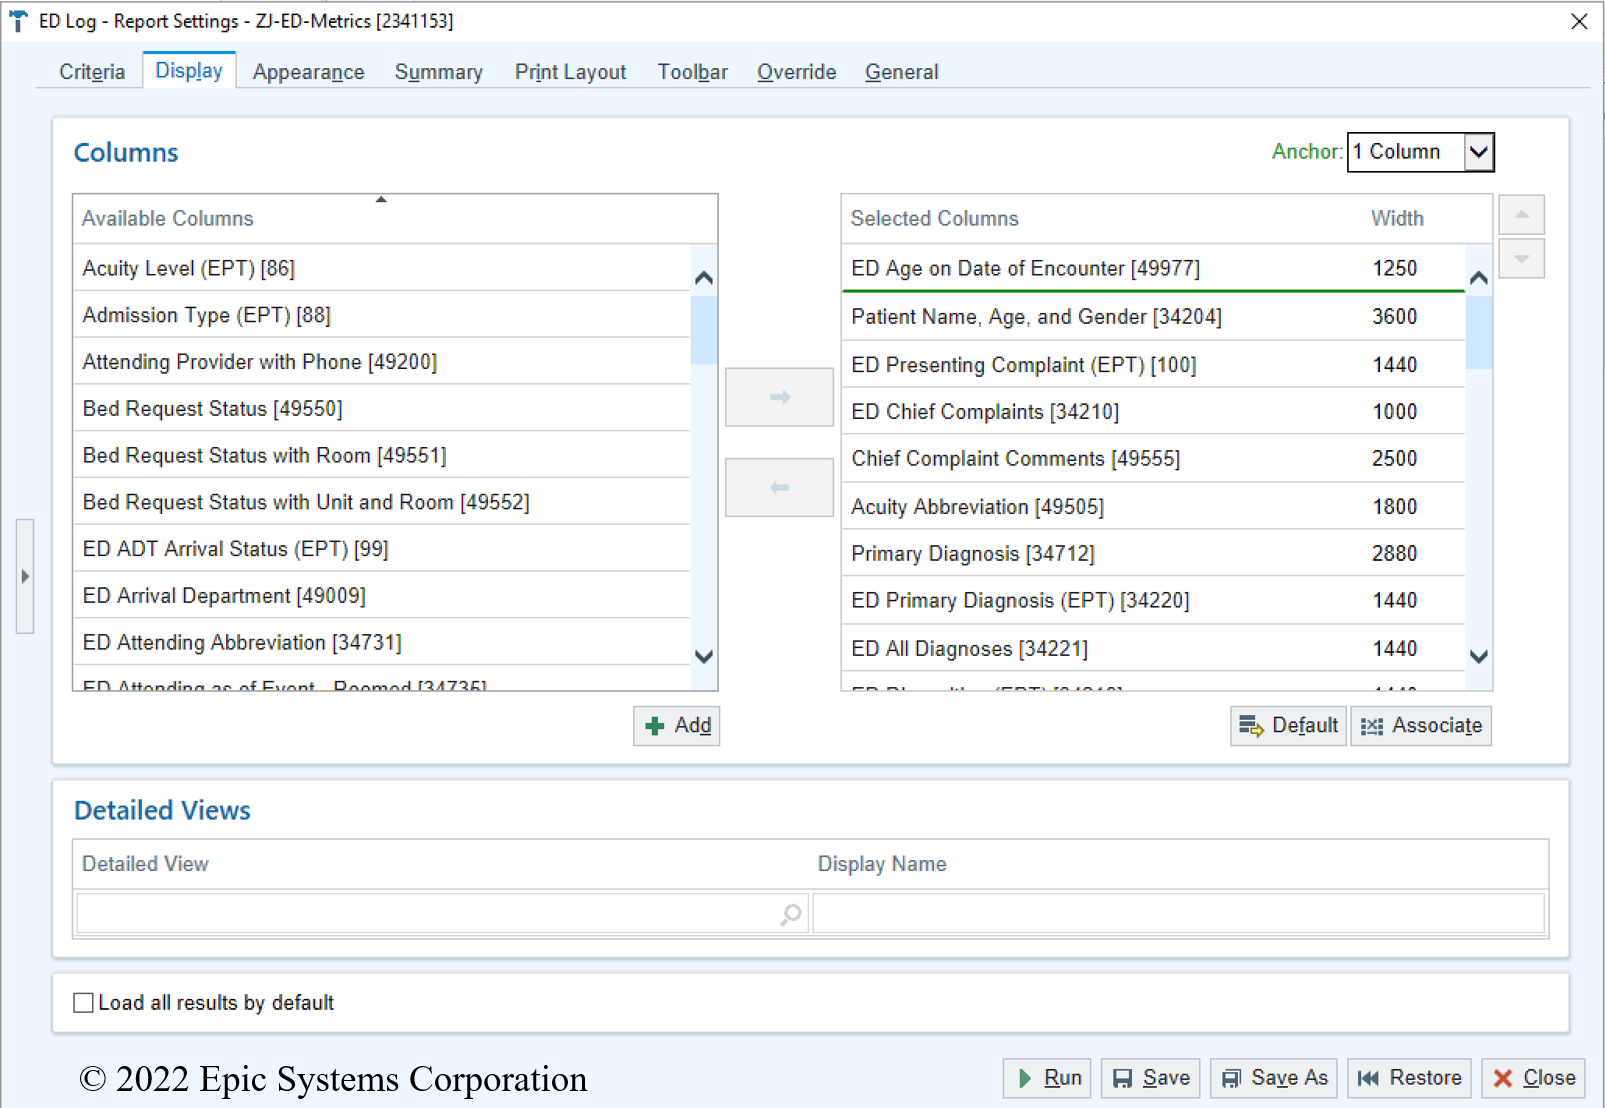
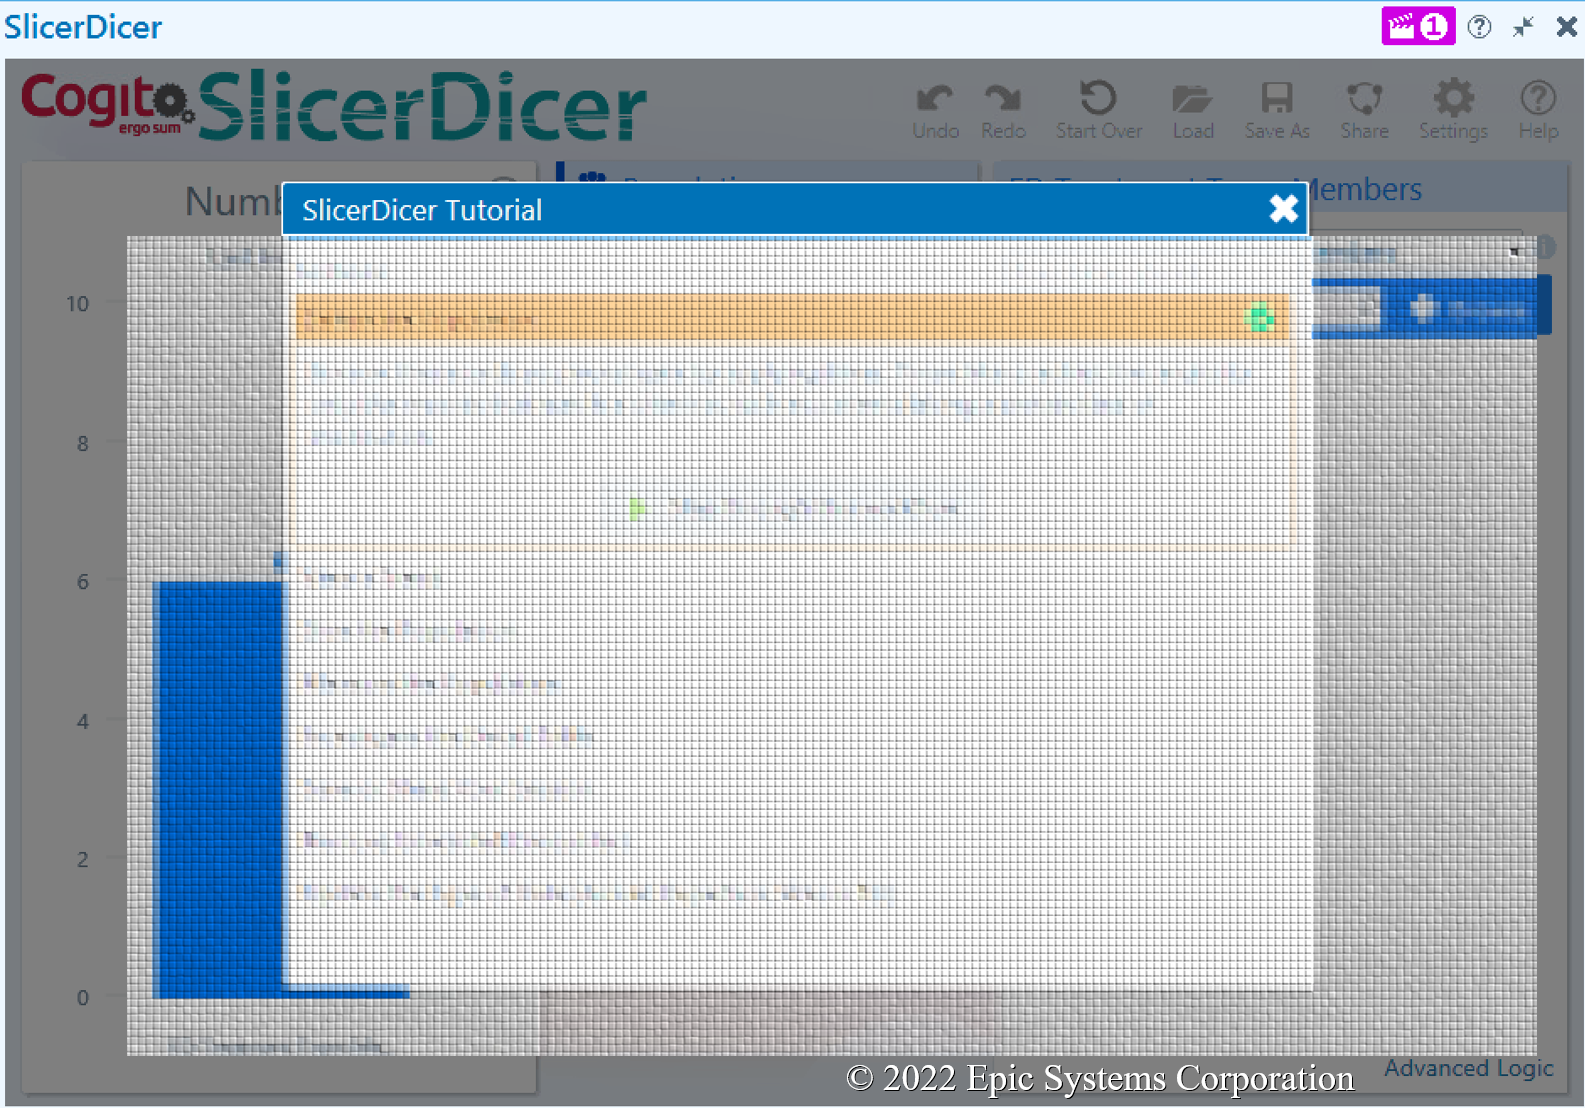
Figure 14. Using SlicerDicer
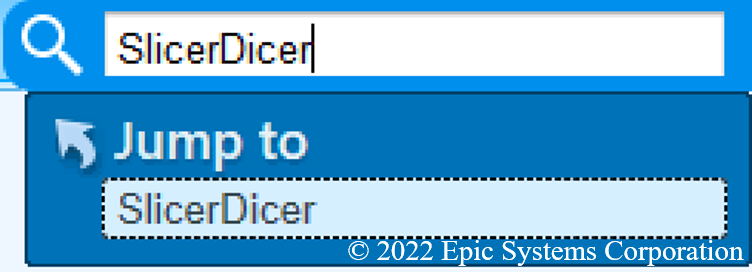
Open SlicerDicer by using a “Jump to” search or finding SlicerDicer within the navigation menu.
After opening SlicerDicer, you will be asked to select a data model. The number of data models that is displayed is related to your user security settings. For instance, there are data models for BestPractice Advisories that you might be able to ask for permission to access if you would like to audit which BPAs are firing most often in the emergency department.
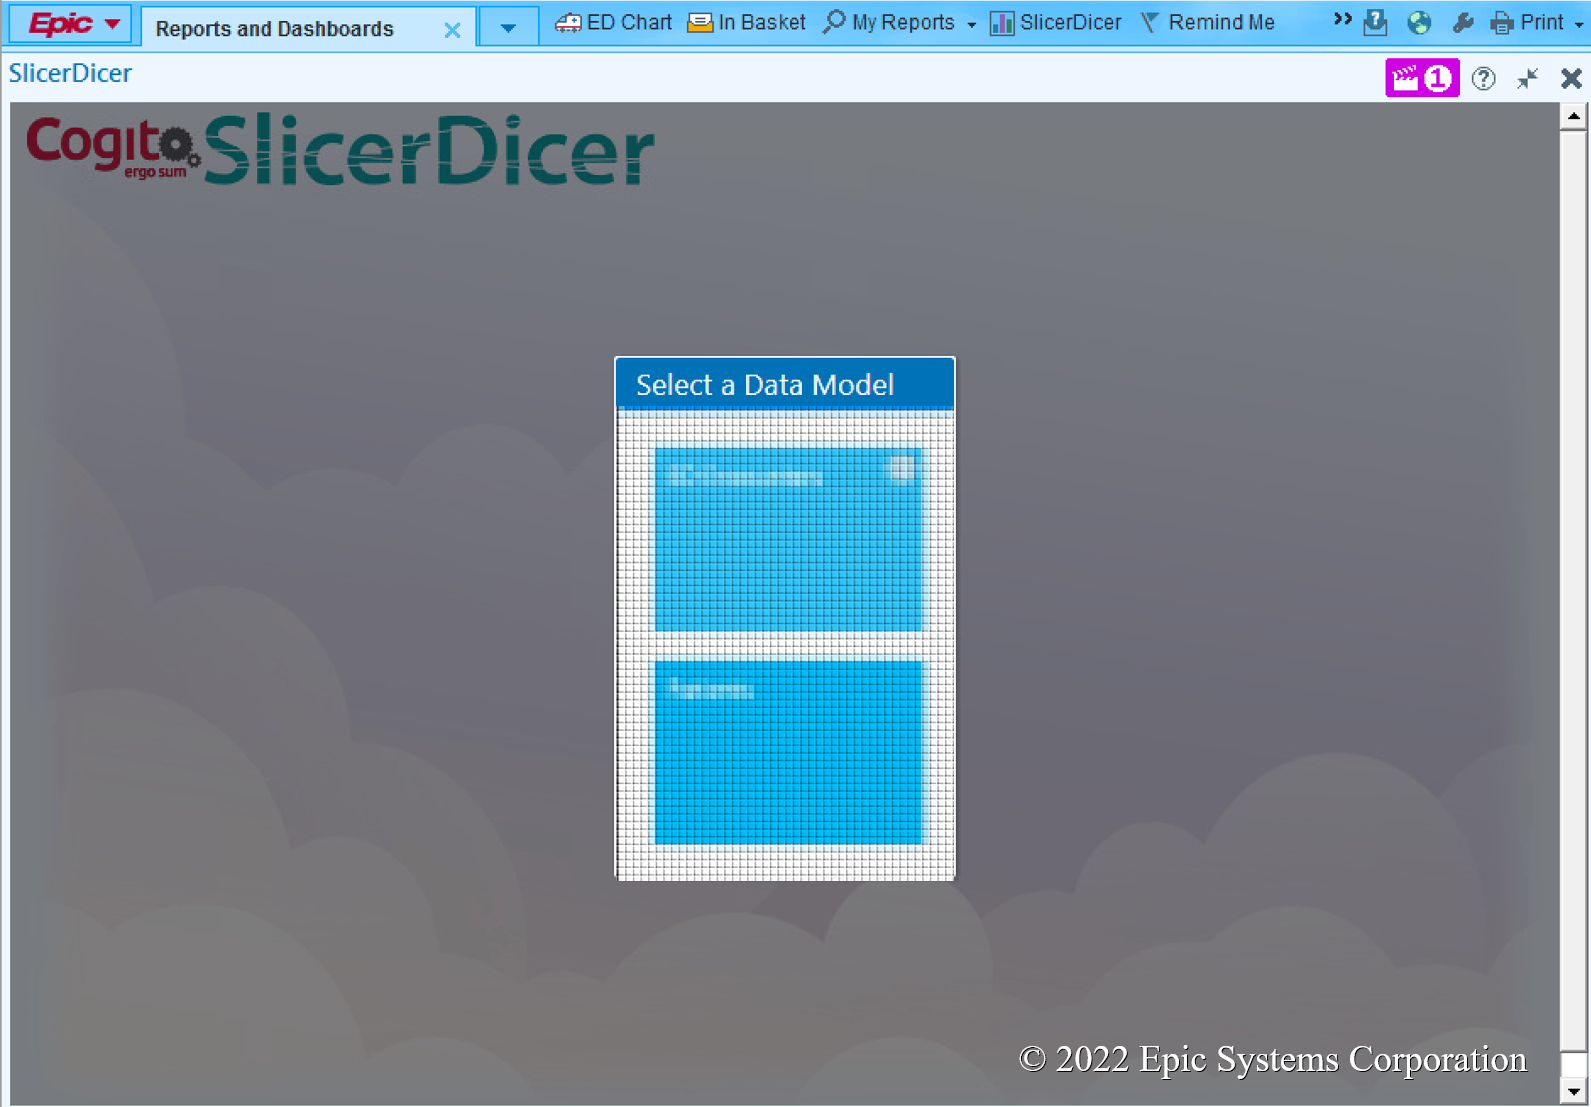
The first time you select a data model within SlicerDicer, you will be taken to a tutorial that will walk you through the steps of how to define a population, view trends, create subgroups, and compare measurements between subgroups.
Join the Epic UserWeb
The Epic UserWeb is open to all Epic users and creating an account is usually as easy as selecting your organization and verifying your credentials using your hospital or health system’s single-sign-on (though some health systems may require additional verification or submission of an application to gain access). Epic’s UserWeb contains:
- Education and training materials
- Upcoming events and webinars
- Downloadable system content
- Community discussion forums
- Implementation, upgrade, and support documentation
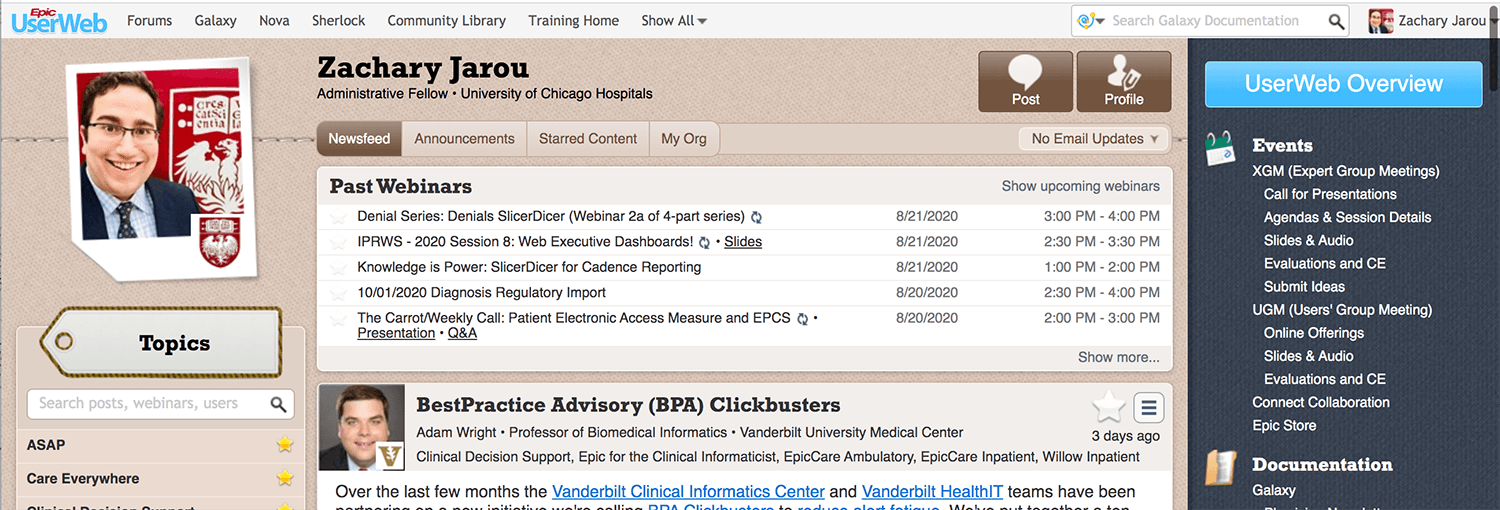
Once logged into the UserWeb, you will be taken to a landing page with many features, however the two that will probably be most useful to you are:
- weLearning: watch short videos with tips & tricks to make Epic easier to use; find the ED-specific ones by searching for “ASAP” (the name of Epic’s ED module)
- Galaxy: learn more about what’s possible by reviewing documentation about how Epic’s many features can be configured/customized (searchable using the search bar in the upper right-hand corner of the screen)
- Forums: learn about how people at other institutions have solved problems you’re facing (searchable using the search bar under the “Topics” subheader on the left-hand side of the screen)
Figure 15. Epic UserWeb Landing Page
All Images Copyrighted: © 2021 Epic Systems Corporation
Created by: Zach Jarou, MD, MBA (St. Joseph Mercy Health System); Heather Heaton, MD (Mayo Clinic); Chris Alban, MD, MBA (Epic); John Reis (Epic); Nick Genes, MD, PhD (Mt. Sinai); Jeff Nielsen, MD, MS (NEOMED); on behalf of the ACEP Health Innovation Technology Committee
